
This is a continuation from the previous article (Part 1) where I analyzed government spending of individual countries that are among the top economies in the world. The data used in this analysis comes from the International Monetary Fund (IMF).
For definitions, explanations, and nuances about the dataset, including the classification of government expenditure by function, please refer to Part 1 of this analysis.
In this part, we continue exploring the remaining countries in the dataset to build a more complete picture of how governments allocate spending across different sectors.
Italy Government Spending Analysis
Italy’s dataset spans from 1995 to 2023.
Social protection dominates government spending, typically exceeding 40%, making it one of the highest among major economies. Health and general public services follow, with education and economic affairs forming a secondary tier.
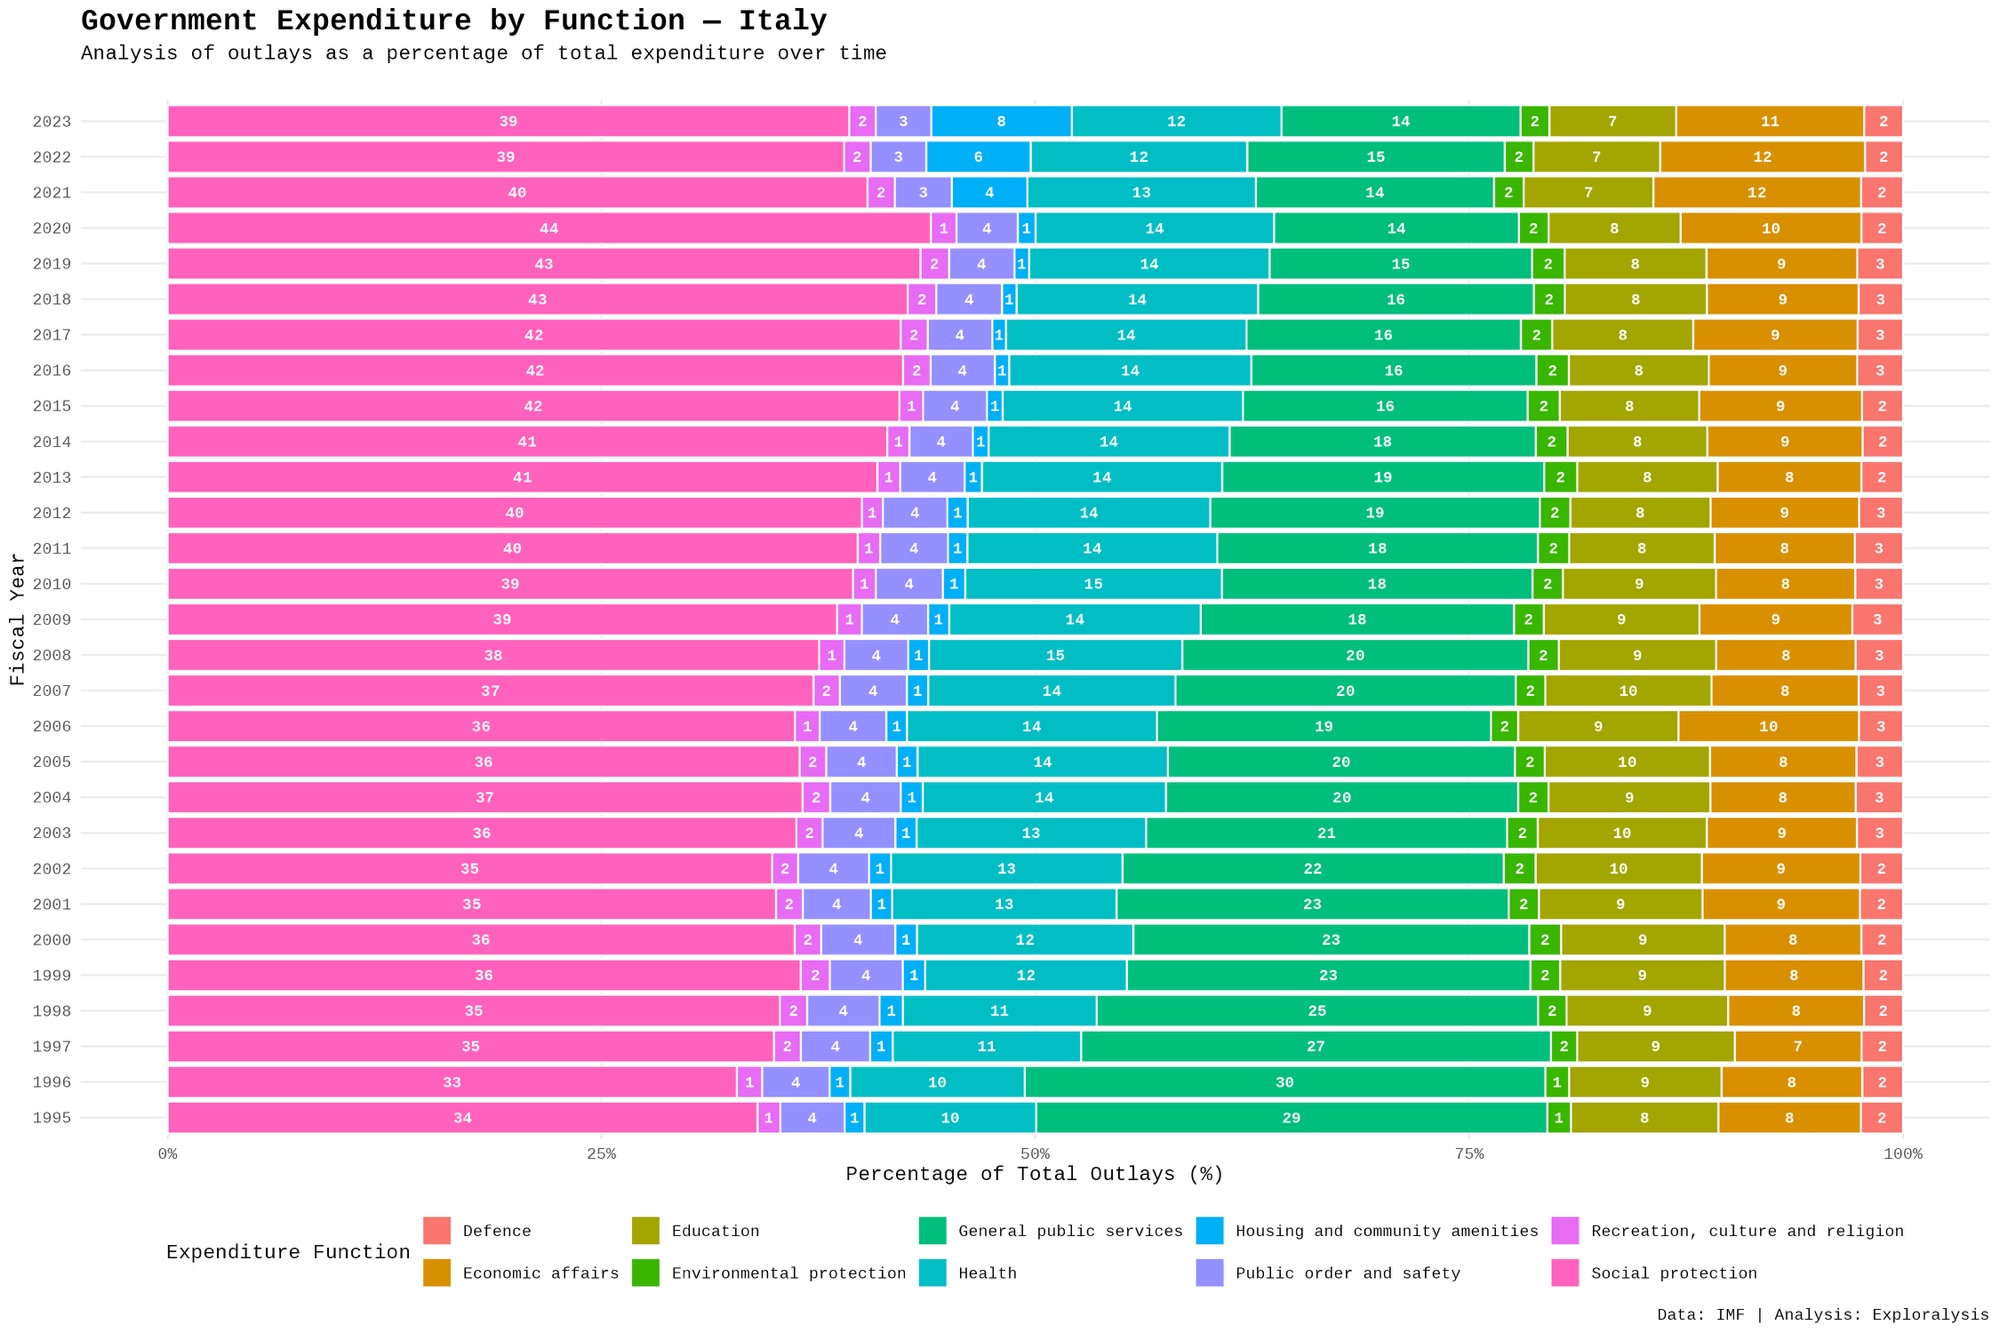
Over time, most categories remain relatively stable. Health shows a gradual increase, while general public services decline slightly. Economic affairs fluctuate modestly, often responding to broader economic conditions.
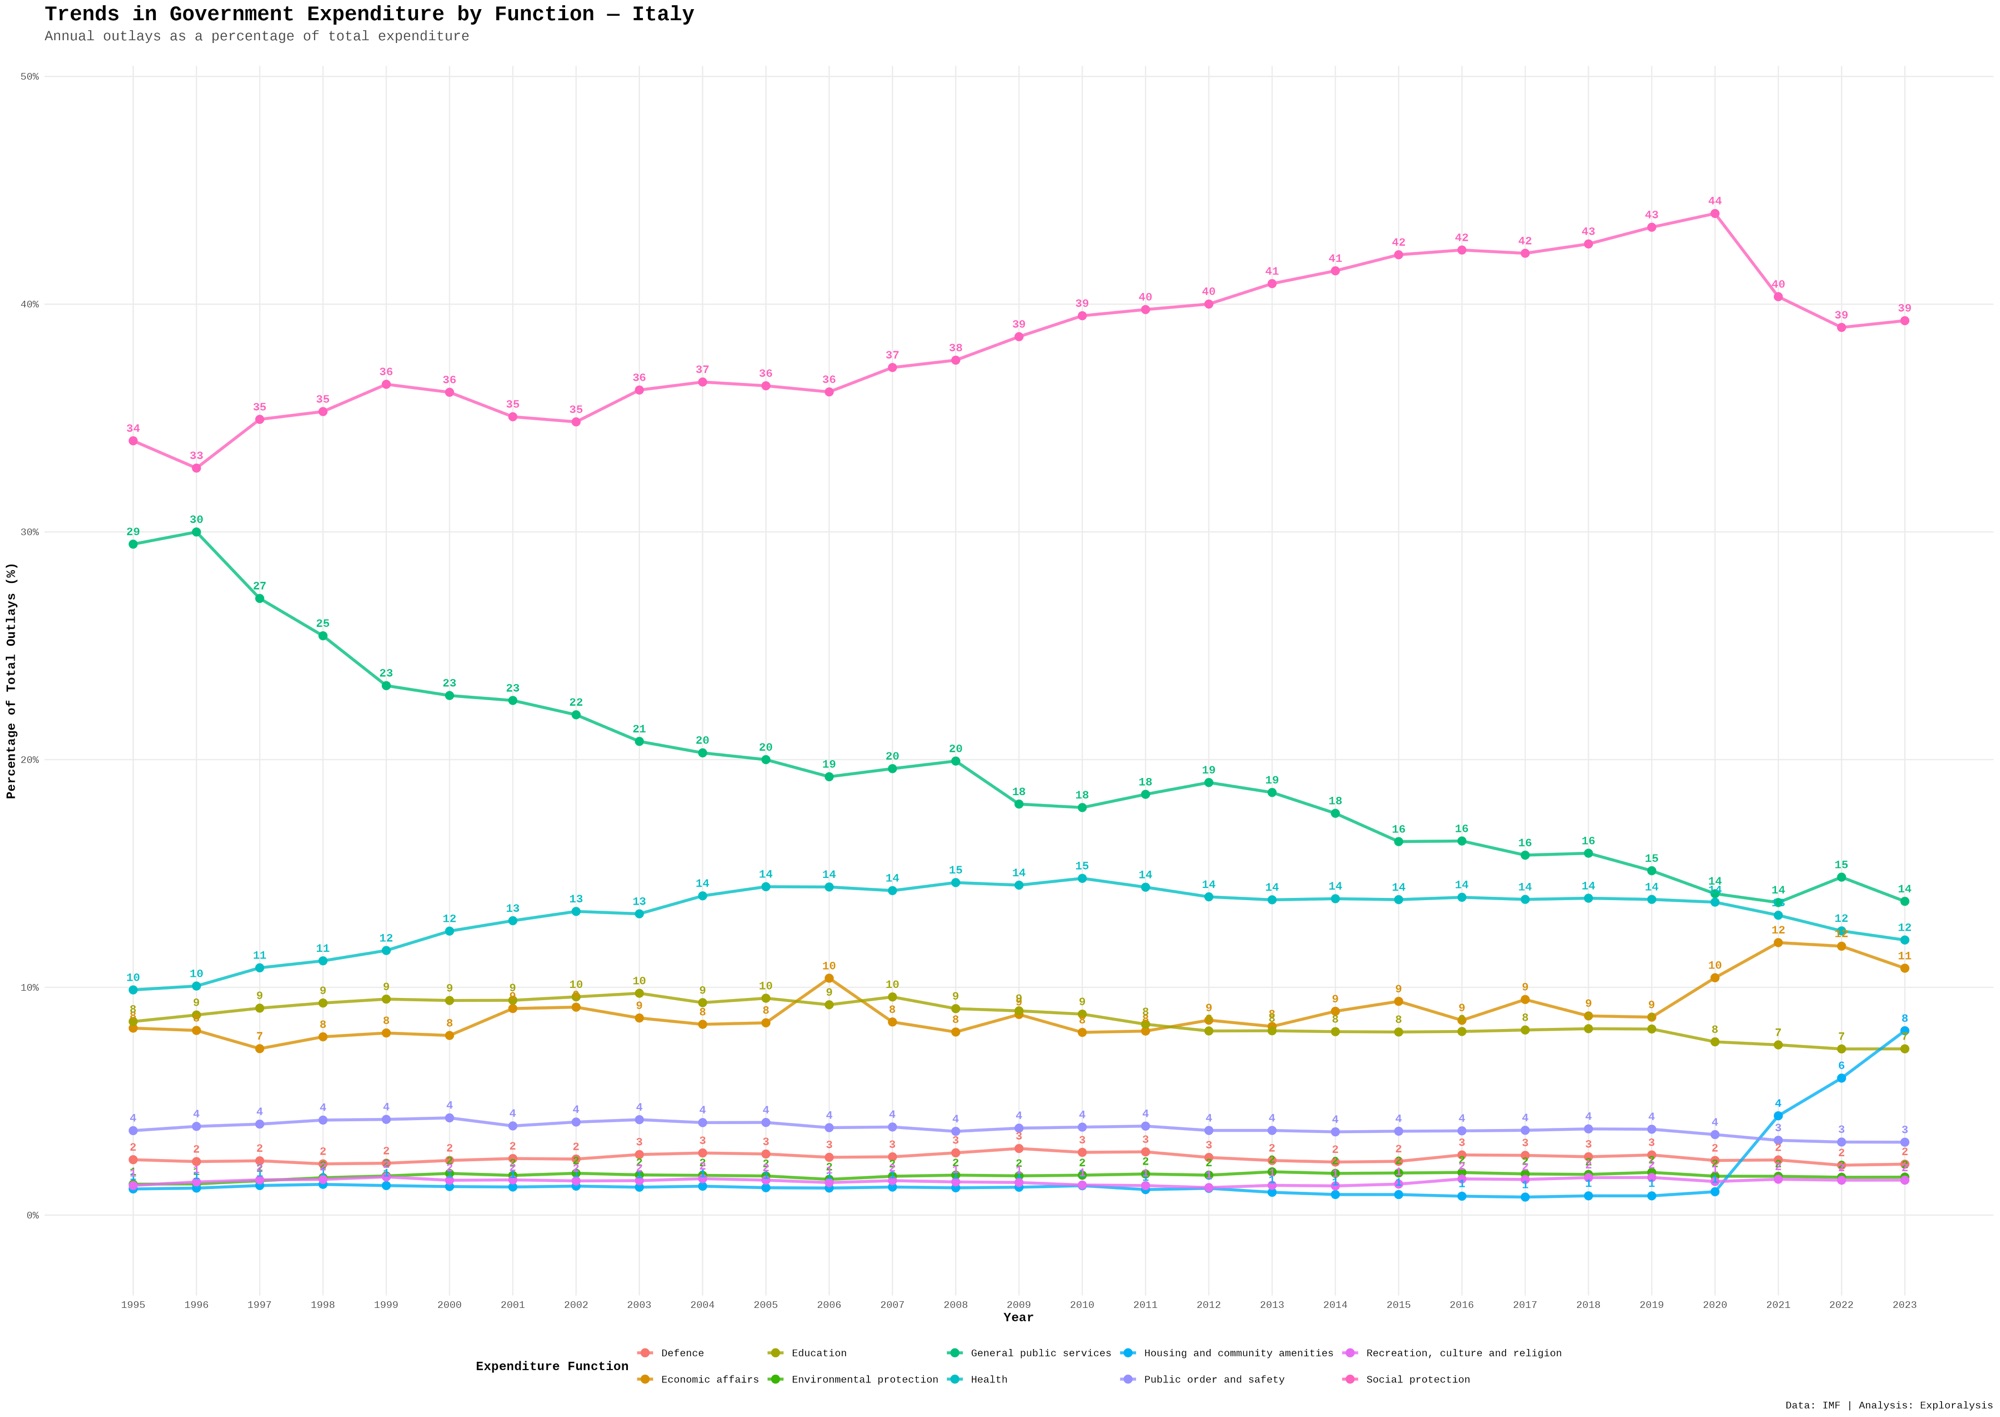
Italy’s high share of social protection reflects demographic pressures, particularly an aging population, as well as a strong welfare system. The stability across categories suggests a consistent policy approach over time.
Russia Government Spending Analysis
Russia’s data covers 2005 to 2023.
Economic affairs and defense play a more prominent role compared to many Western economies. Social protection remains significant but does not dominate to the same extent as in European countries.
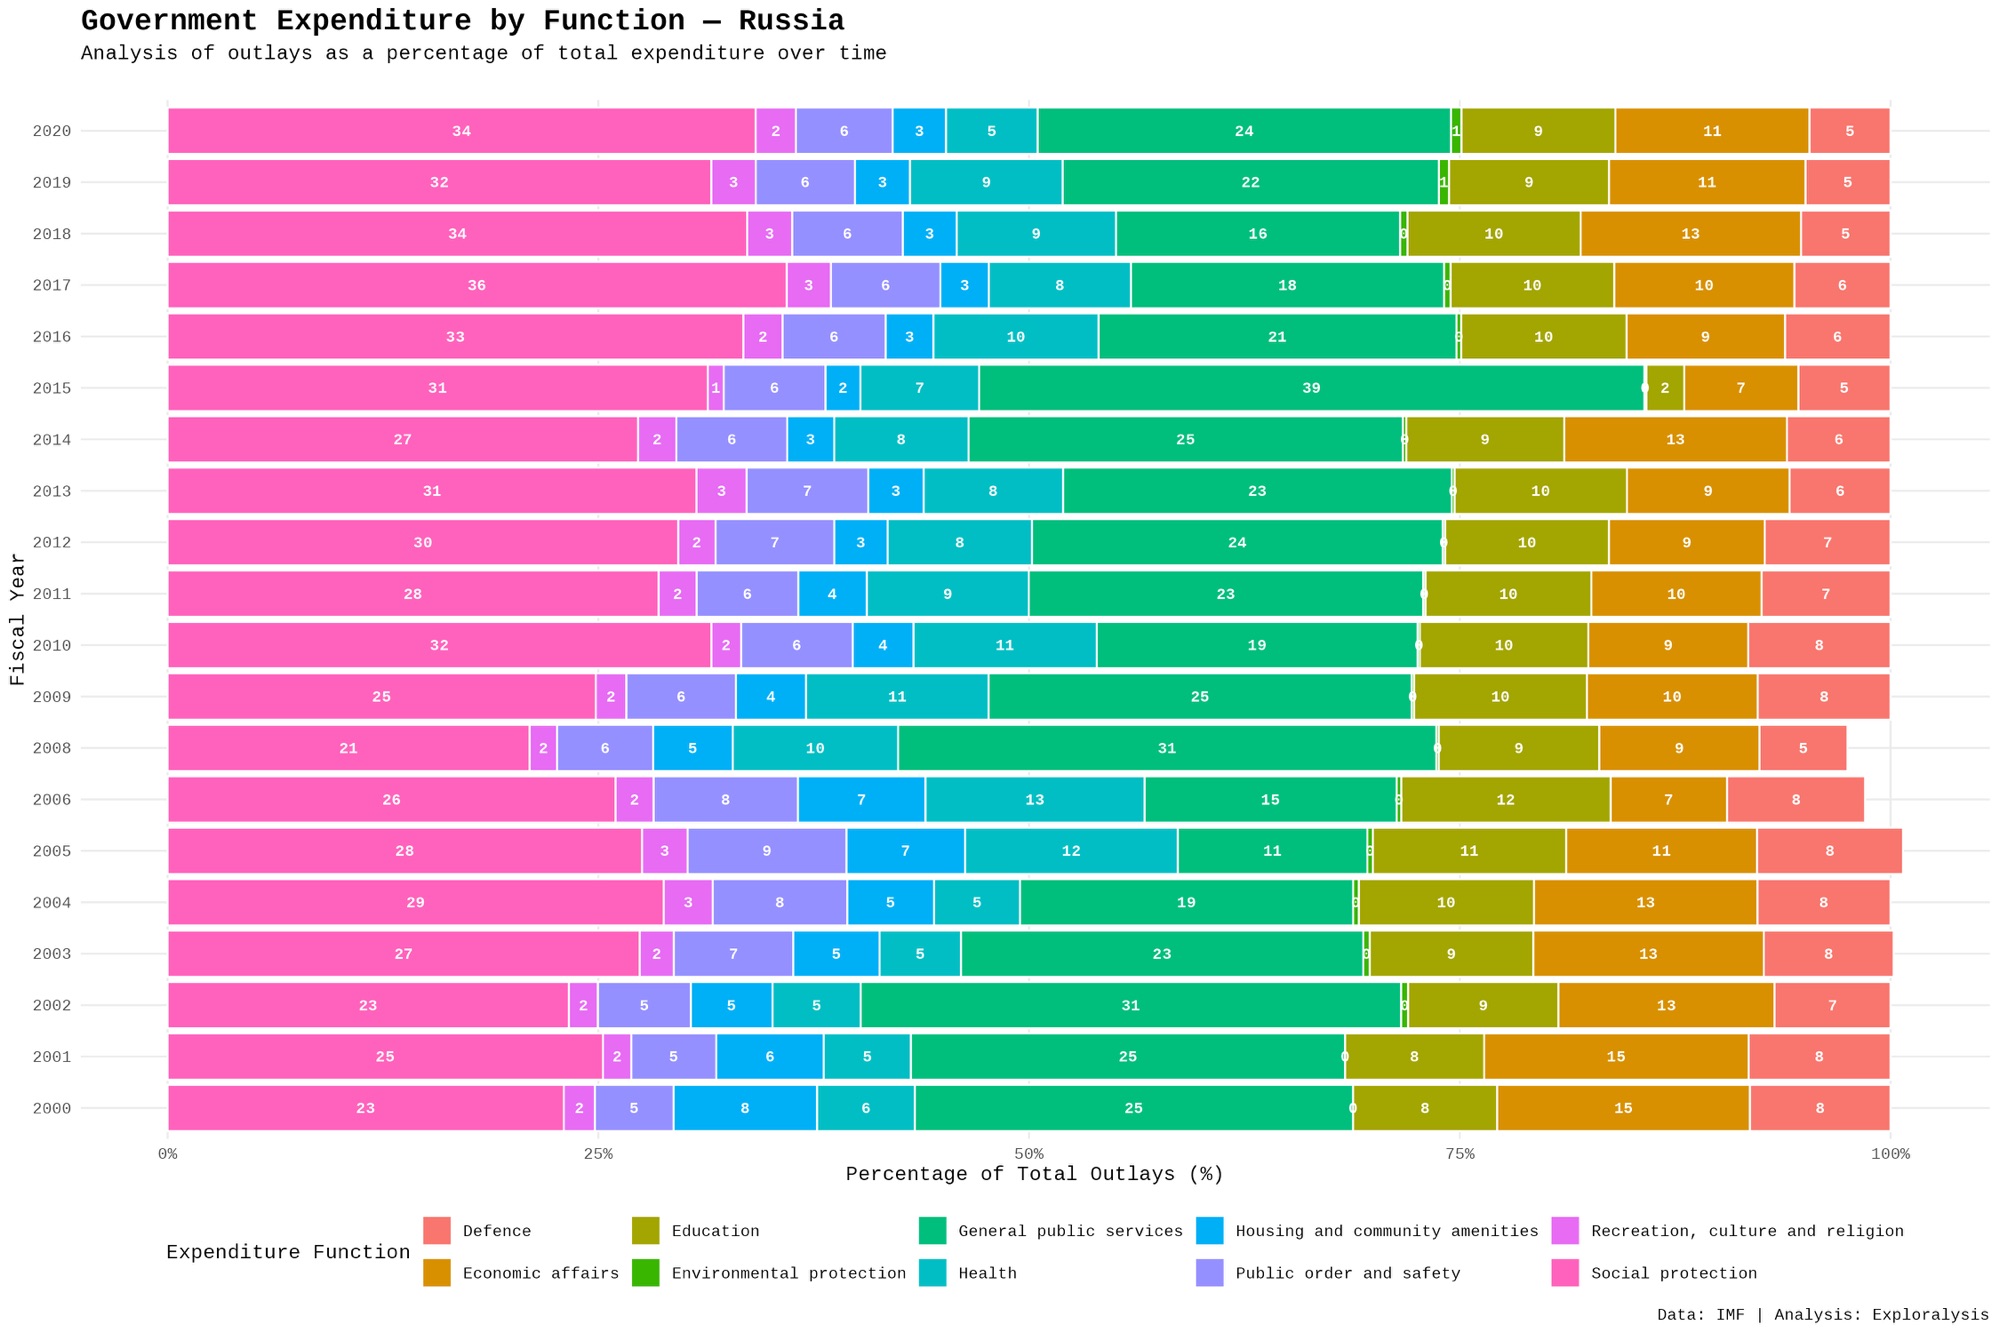
Defense spending is notably higher than in most other countries in the dataset, reflecting geopolitical priorities. Economic affairs also maintain a strong presence, highlighting state involvement in key industries such as energy.
Over time, spending patterns show variability, with shifts between economic affairs, defense, and social protection depending on economic and political conditions.
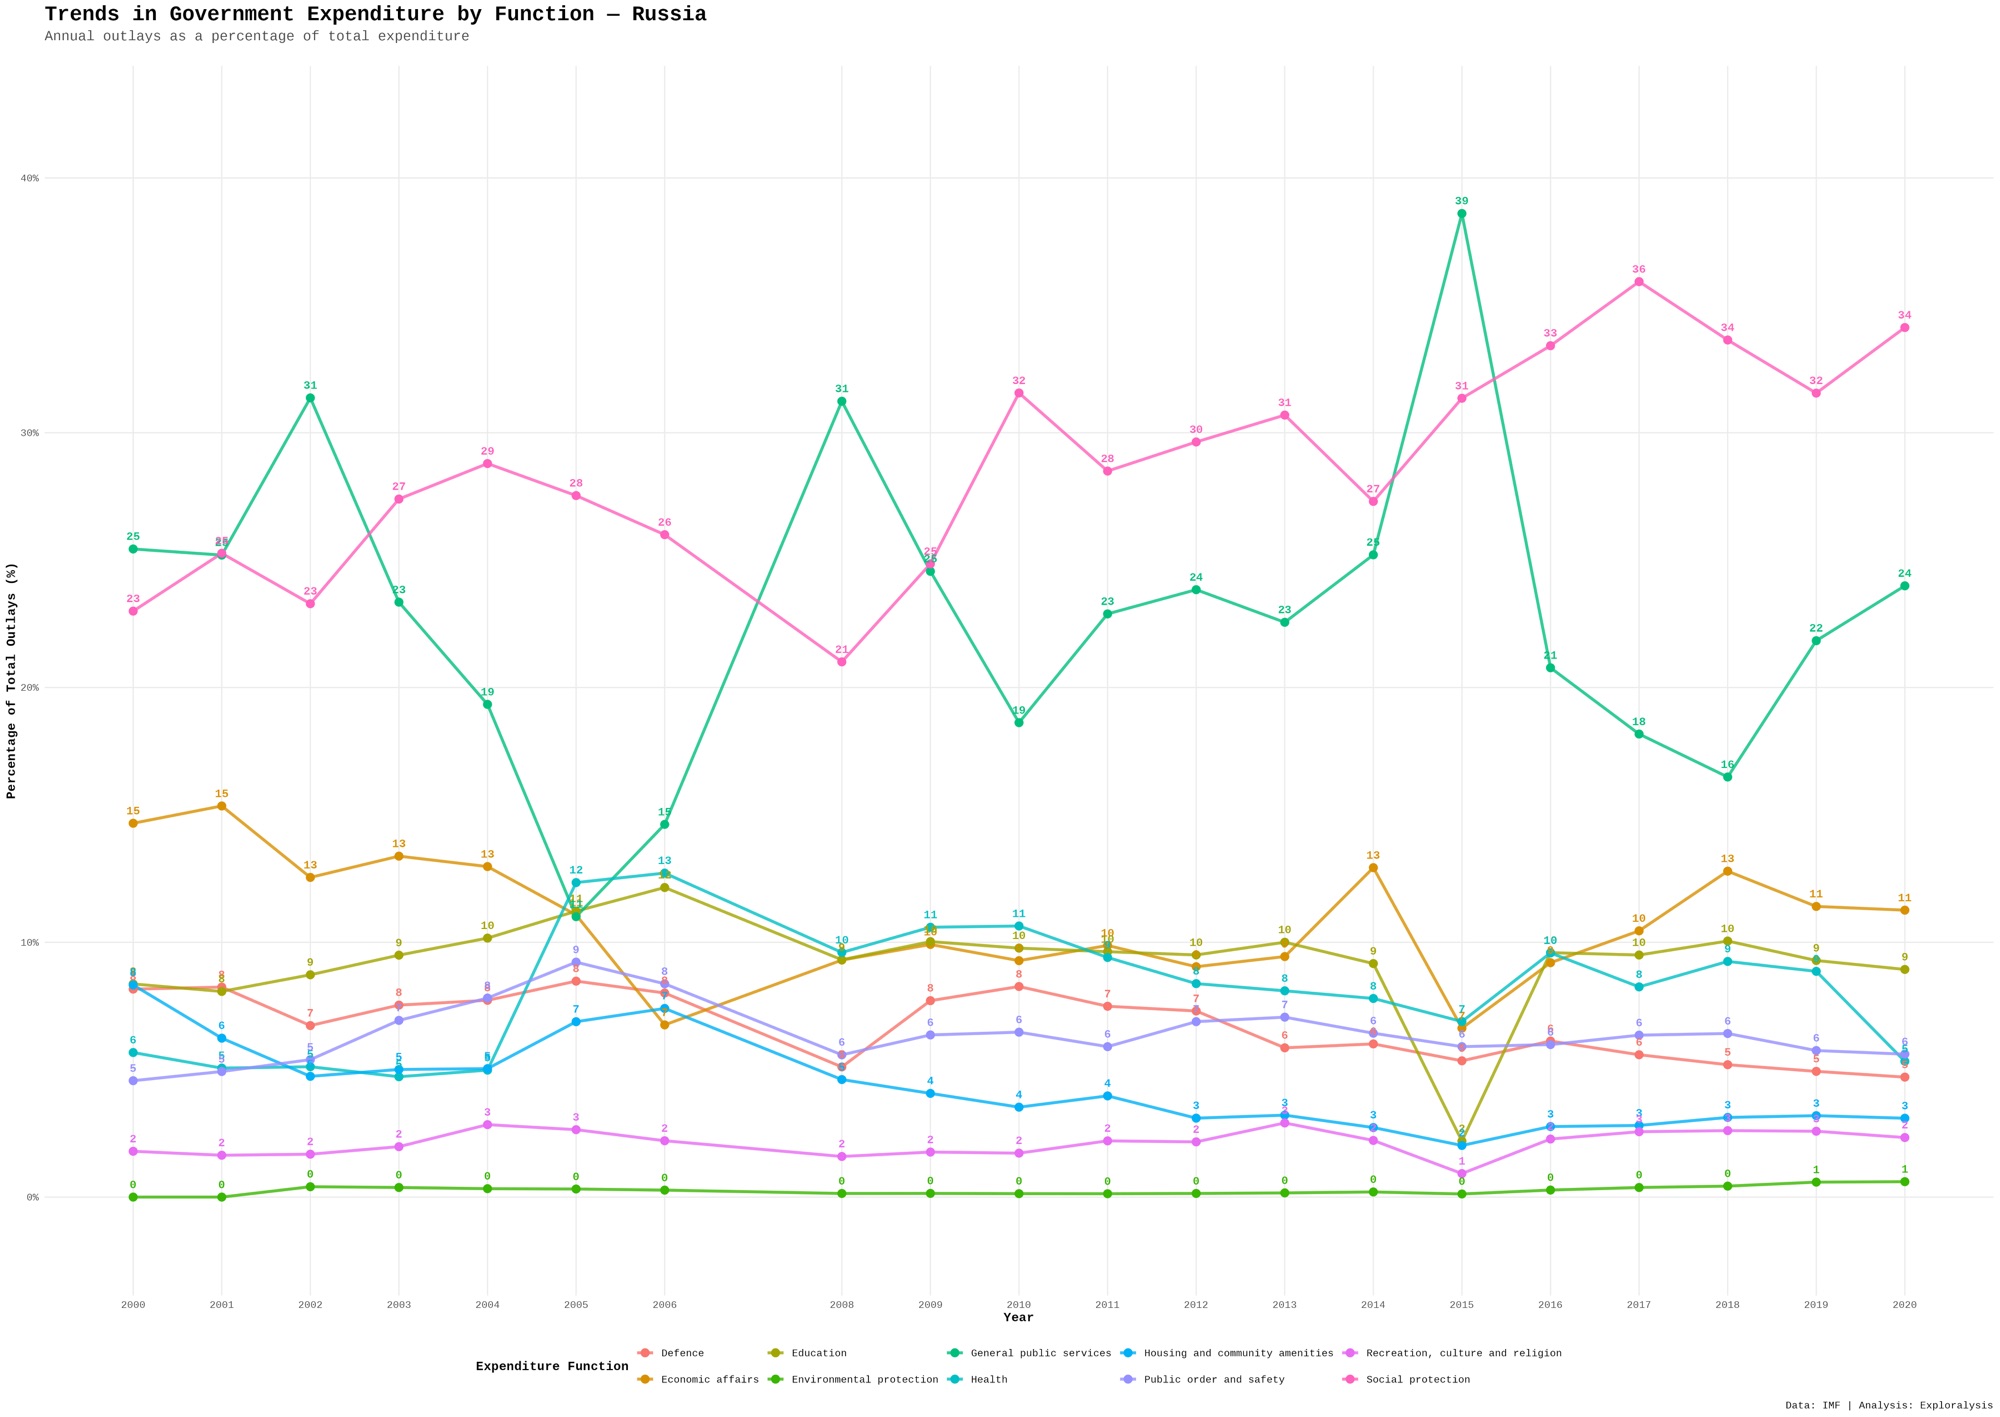
Russia’s spending profile reflects a balance between welfare, state-driven economic development, and national security priorities.
Canada Government Spending Analysis
Canada’s dataset spans from 1995 to 2023.
Social protection and health dominate, followed by general public services and education. The overall structure is similar to other developed Western economies.
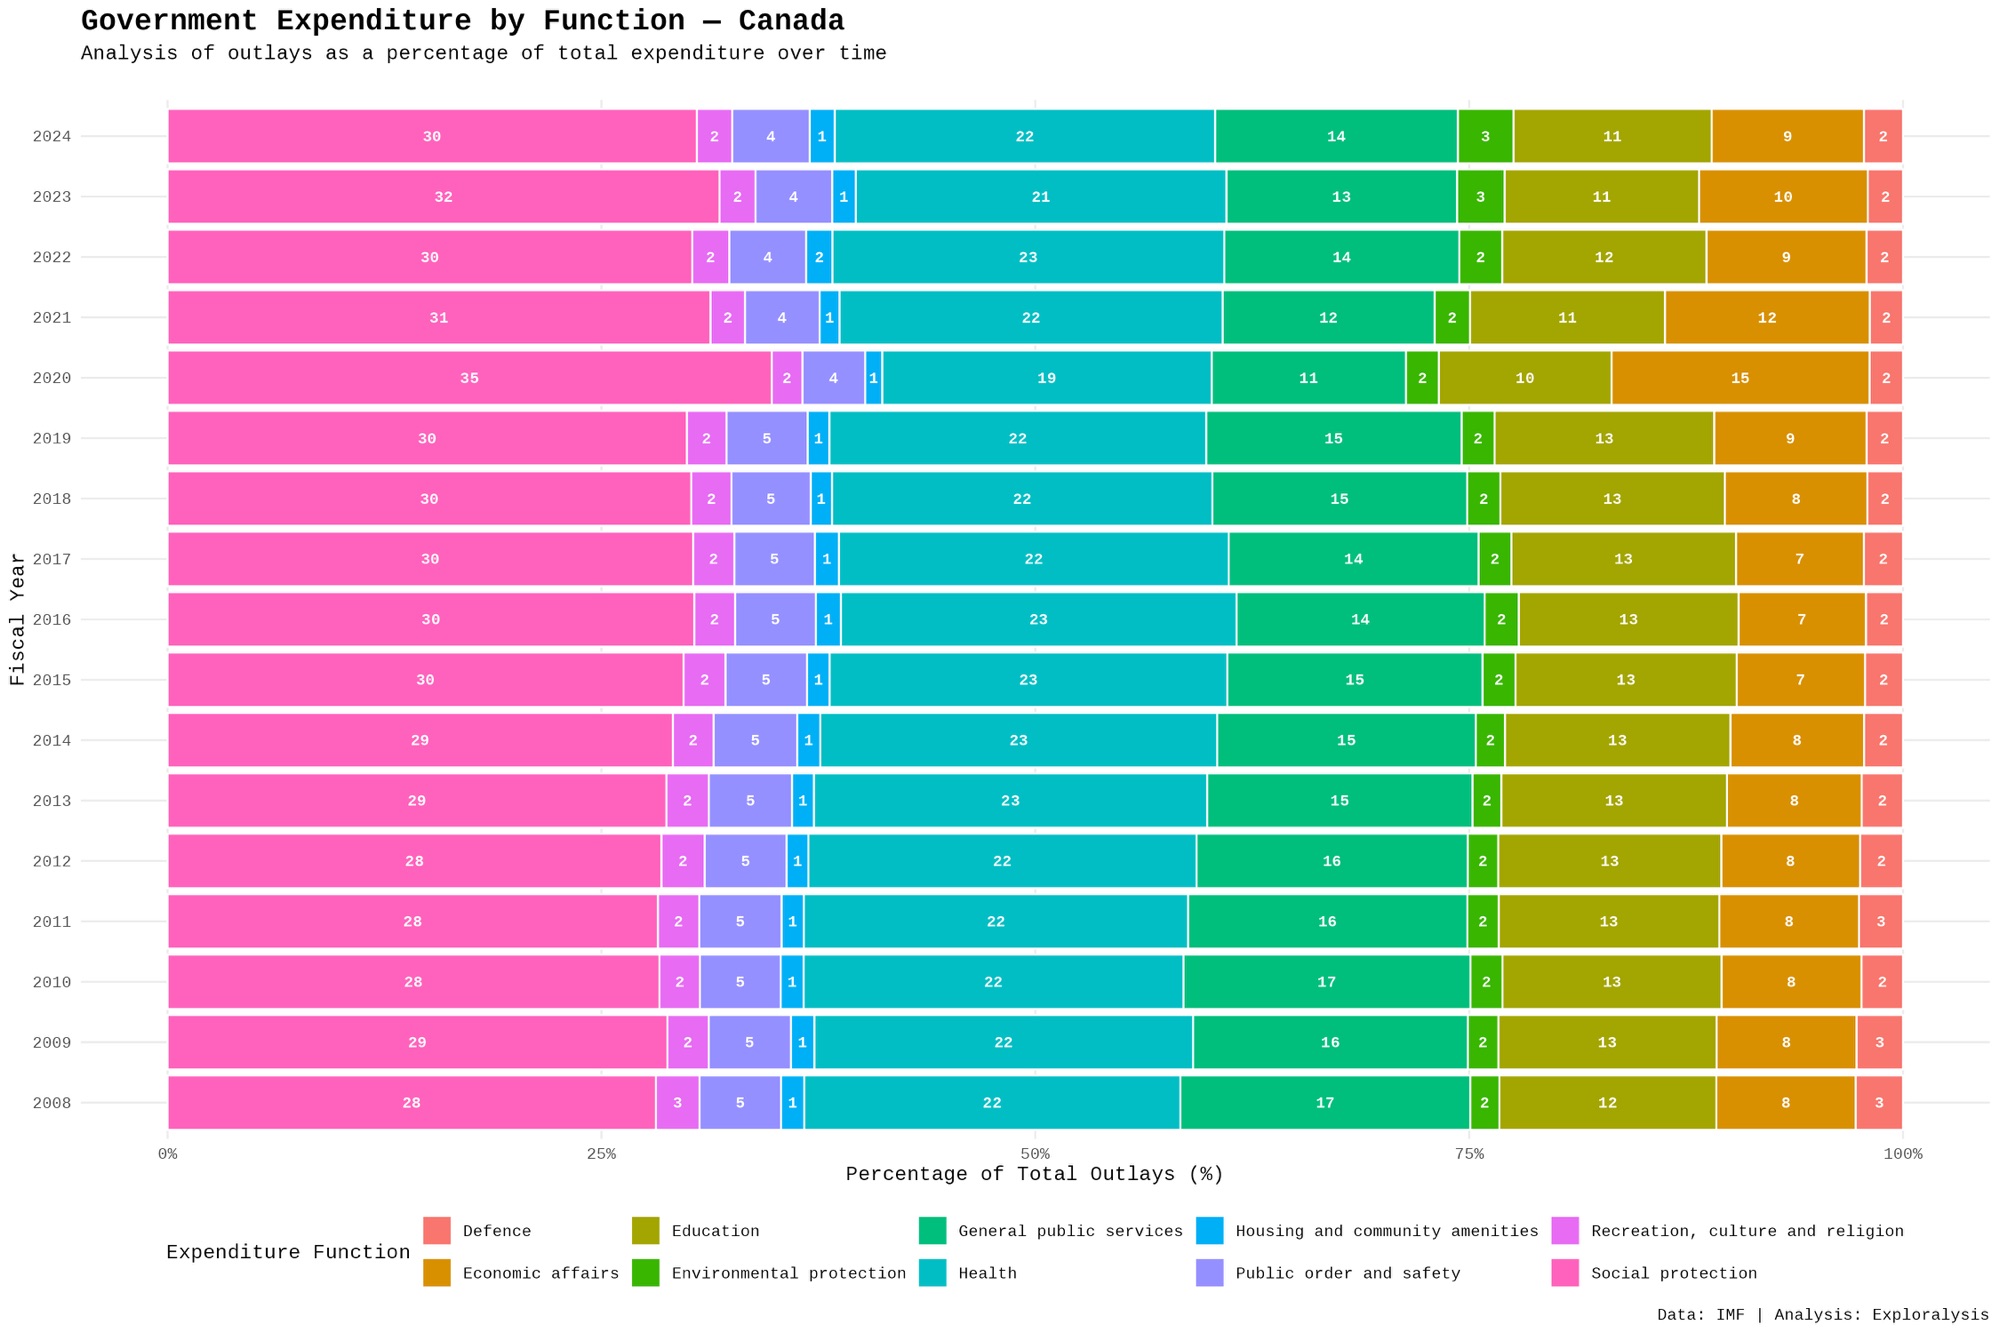
Health spending shows a gradual upward trend, while social protection remains stable with slight fluctuations. Economic affairs and defense remain relatively modest in comparison.
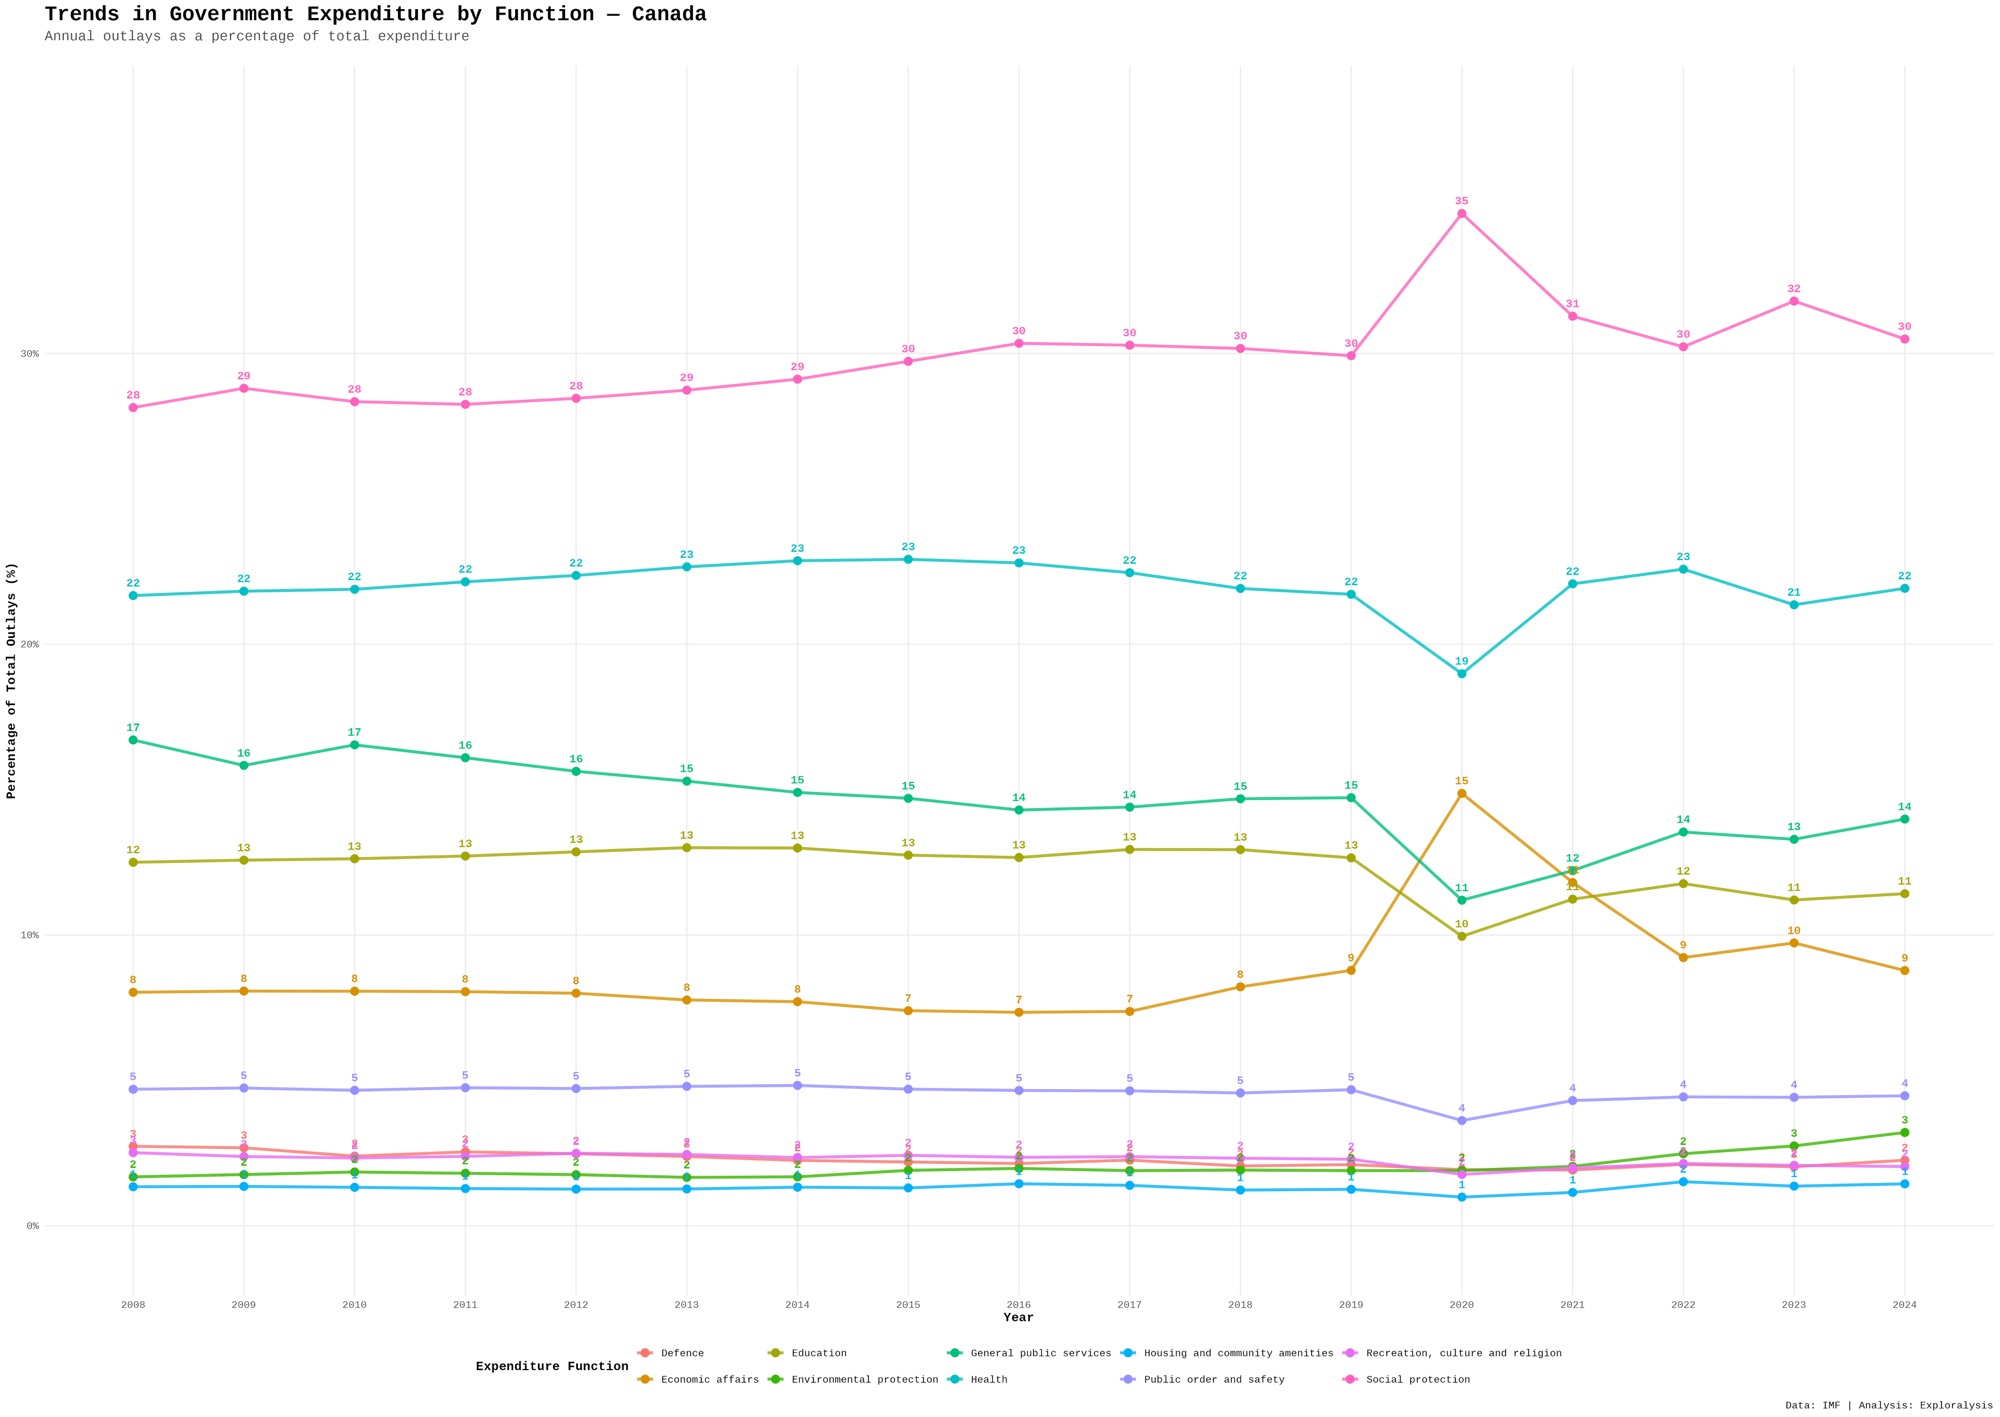
Canada’s spending pattern reflects a strong emphasis on public services and welfare, with consistent investment in healthcare and social programs.
Brazil Government Spending Analysis
Brazil’s data covers 2000 to 2023.
Social protection dominates, often exceeding 40%, followed by general public services and health. Education and economic affairs also play meaningful roles.
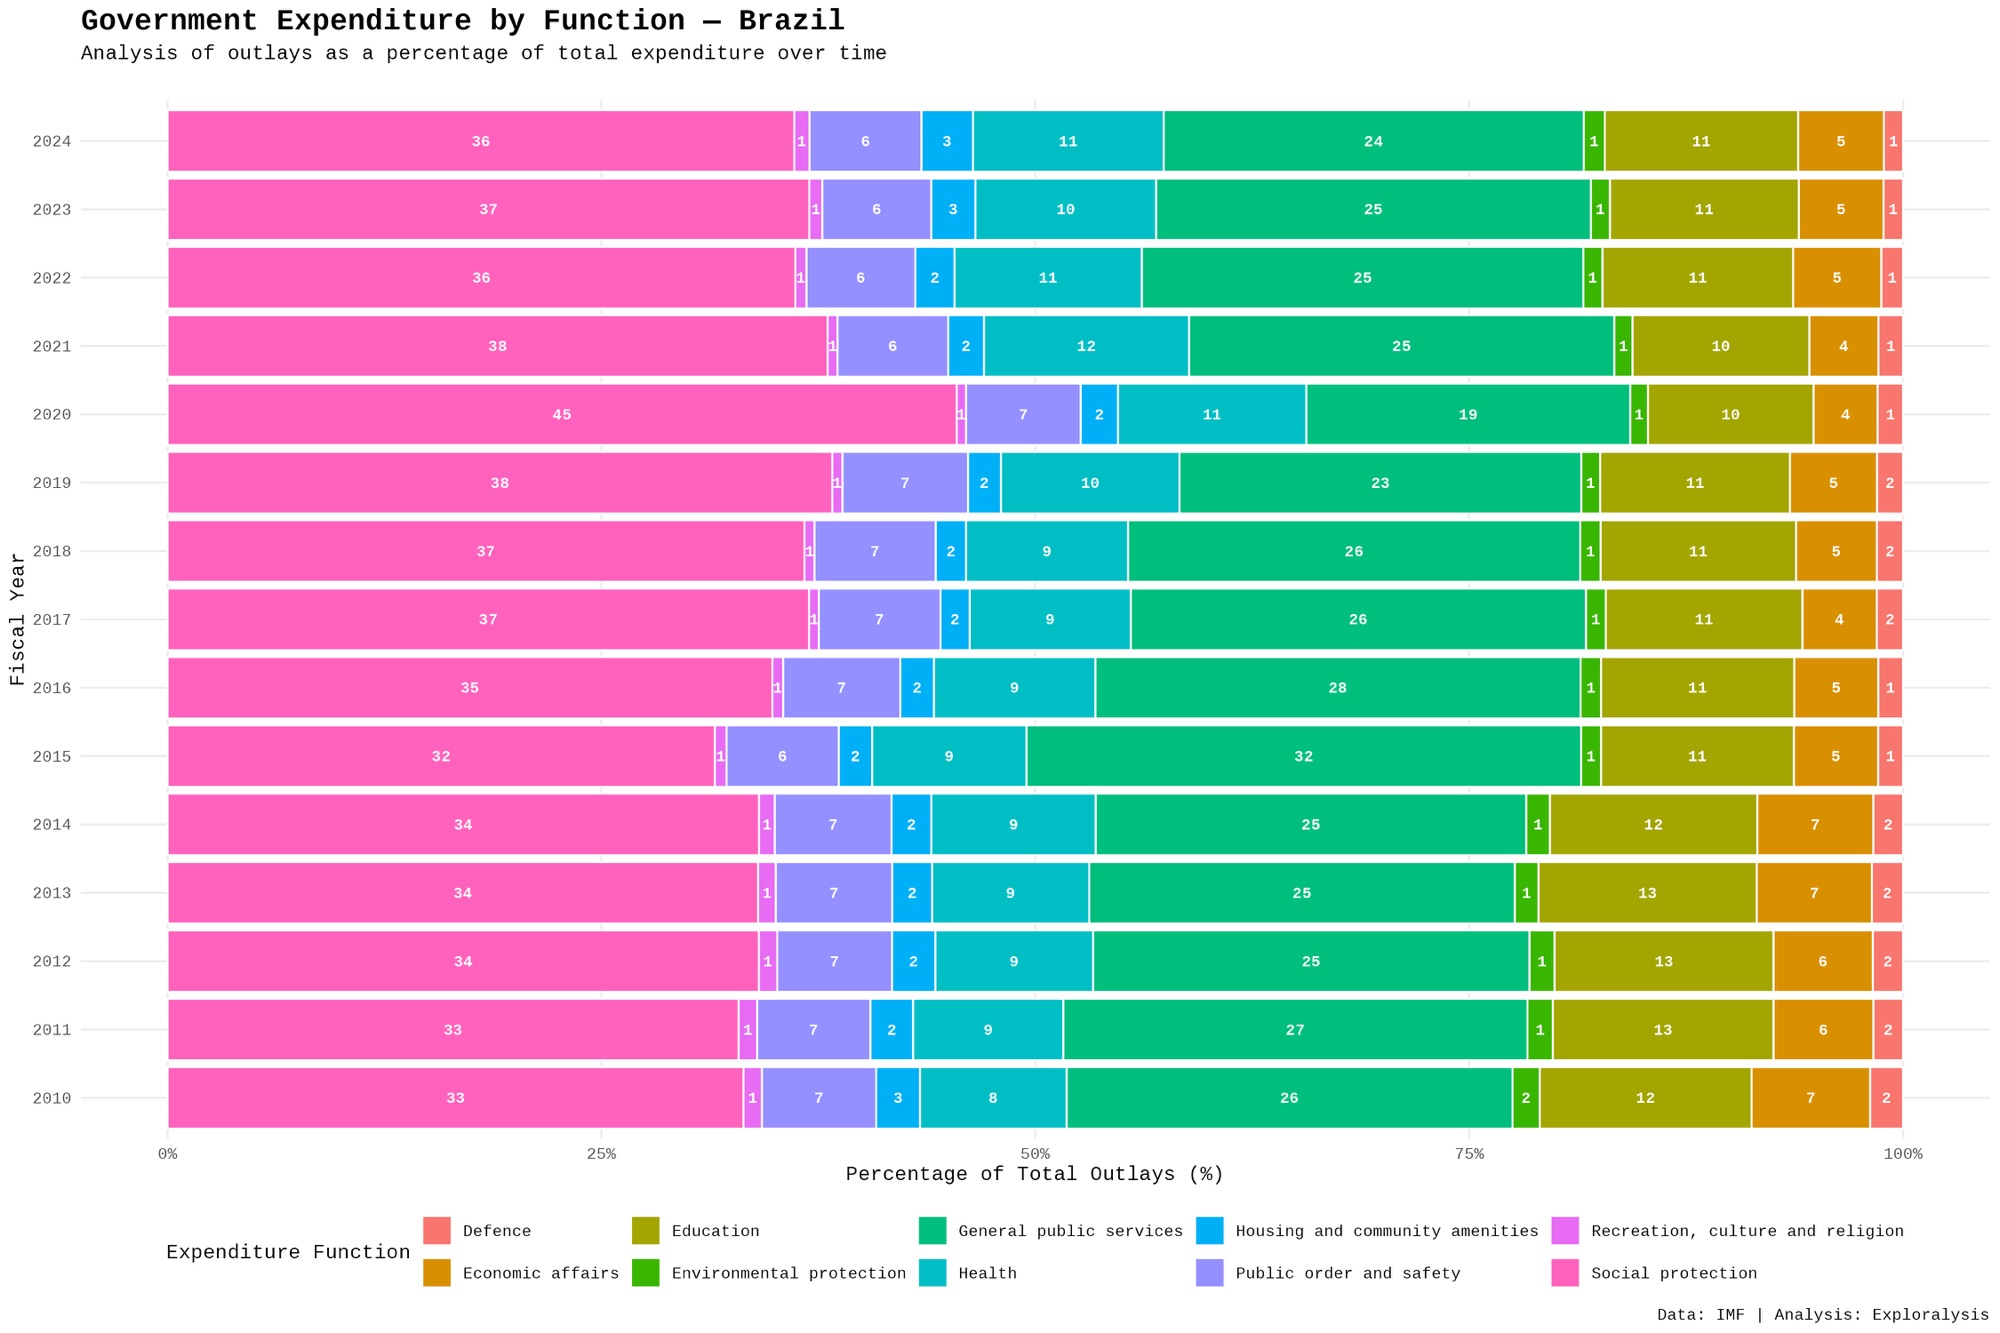
Over time, social protection increases gradually, while economic affairs and general public services fluctuate. Health spending shows steady growth.
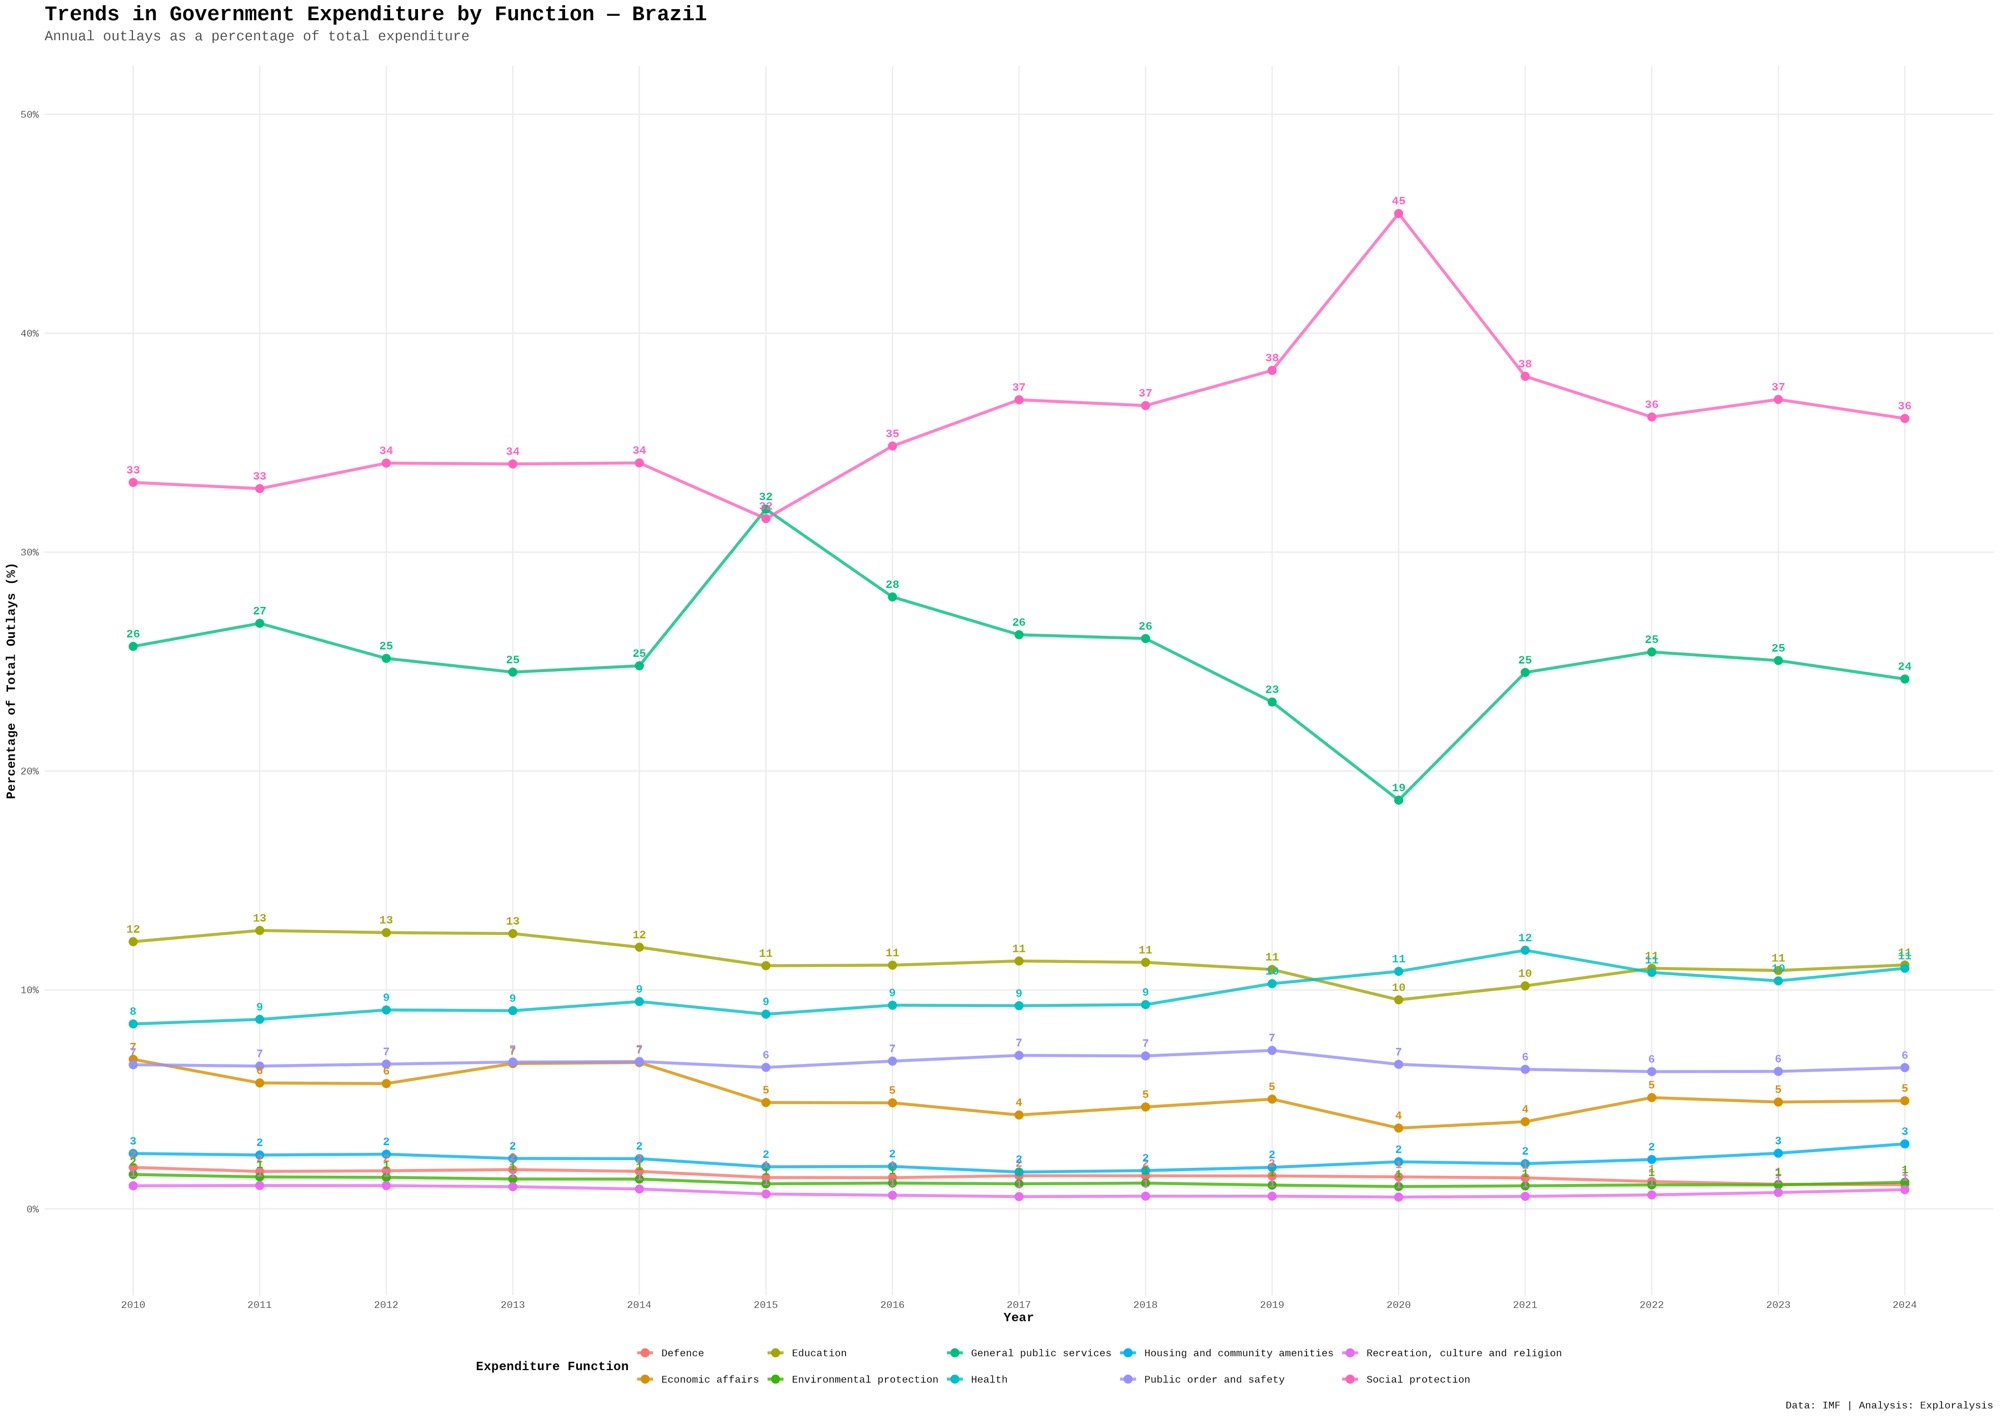
Brazil’s spending pattern highlights a strong commitment to social programs, alongside ongoing efforts to support economic development.
Spain Government Spending Analysis
Spain’s dataset spans from 1995 to 2023.
Social protection leads, followed by health, general public services, and education. Economic affairs show variability, particularly during periods of economic crisis.
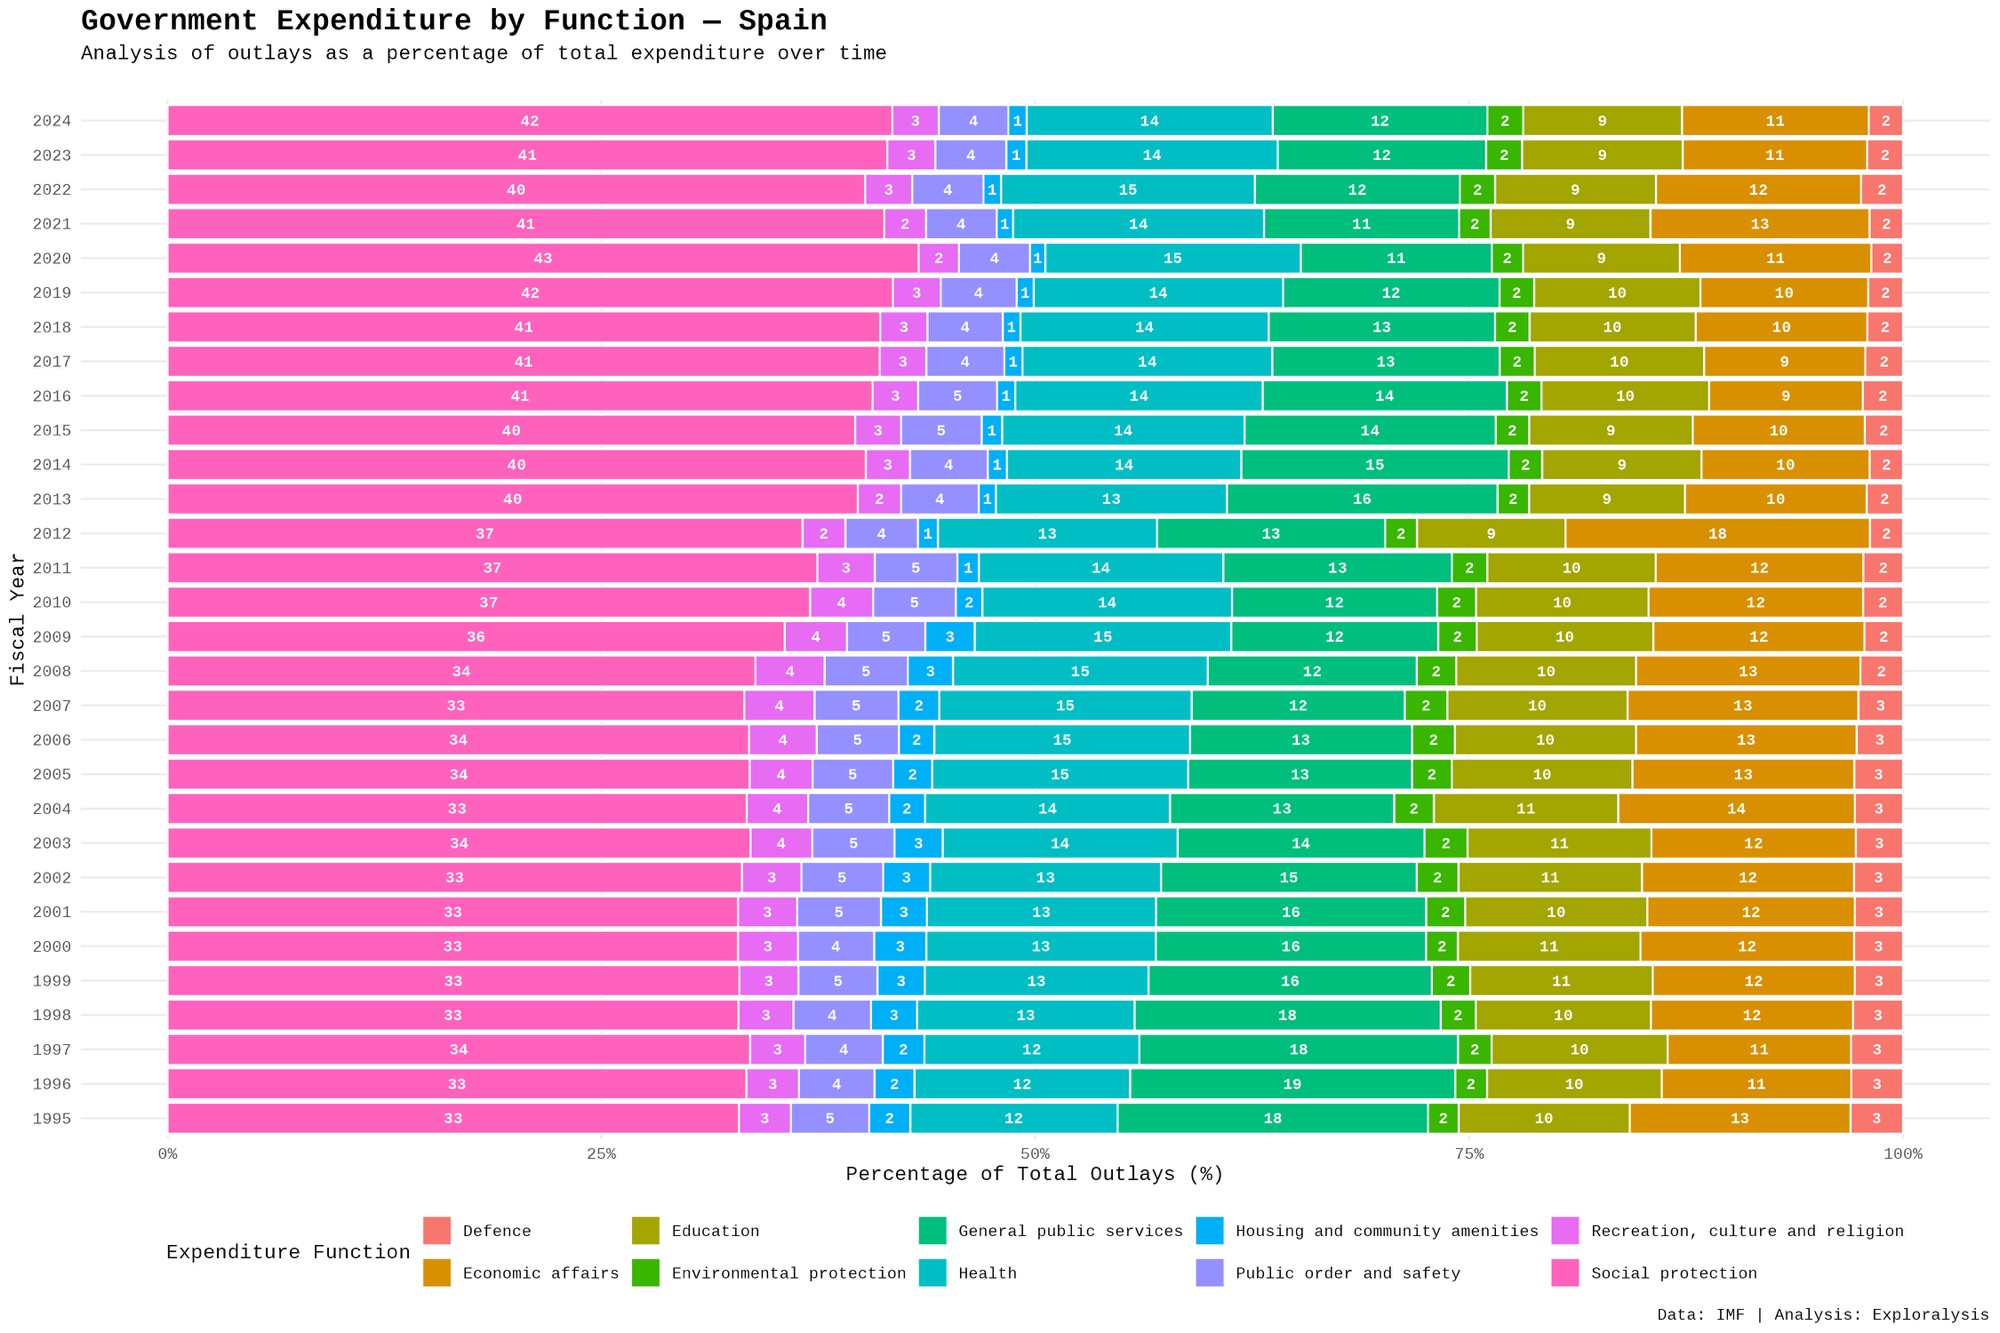
The 2008 financial crisis is reflected in increased economic affairs spending, while subsequent years show adjustments across categories.
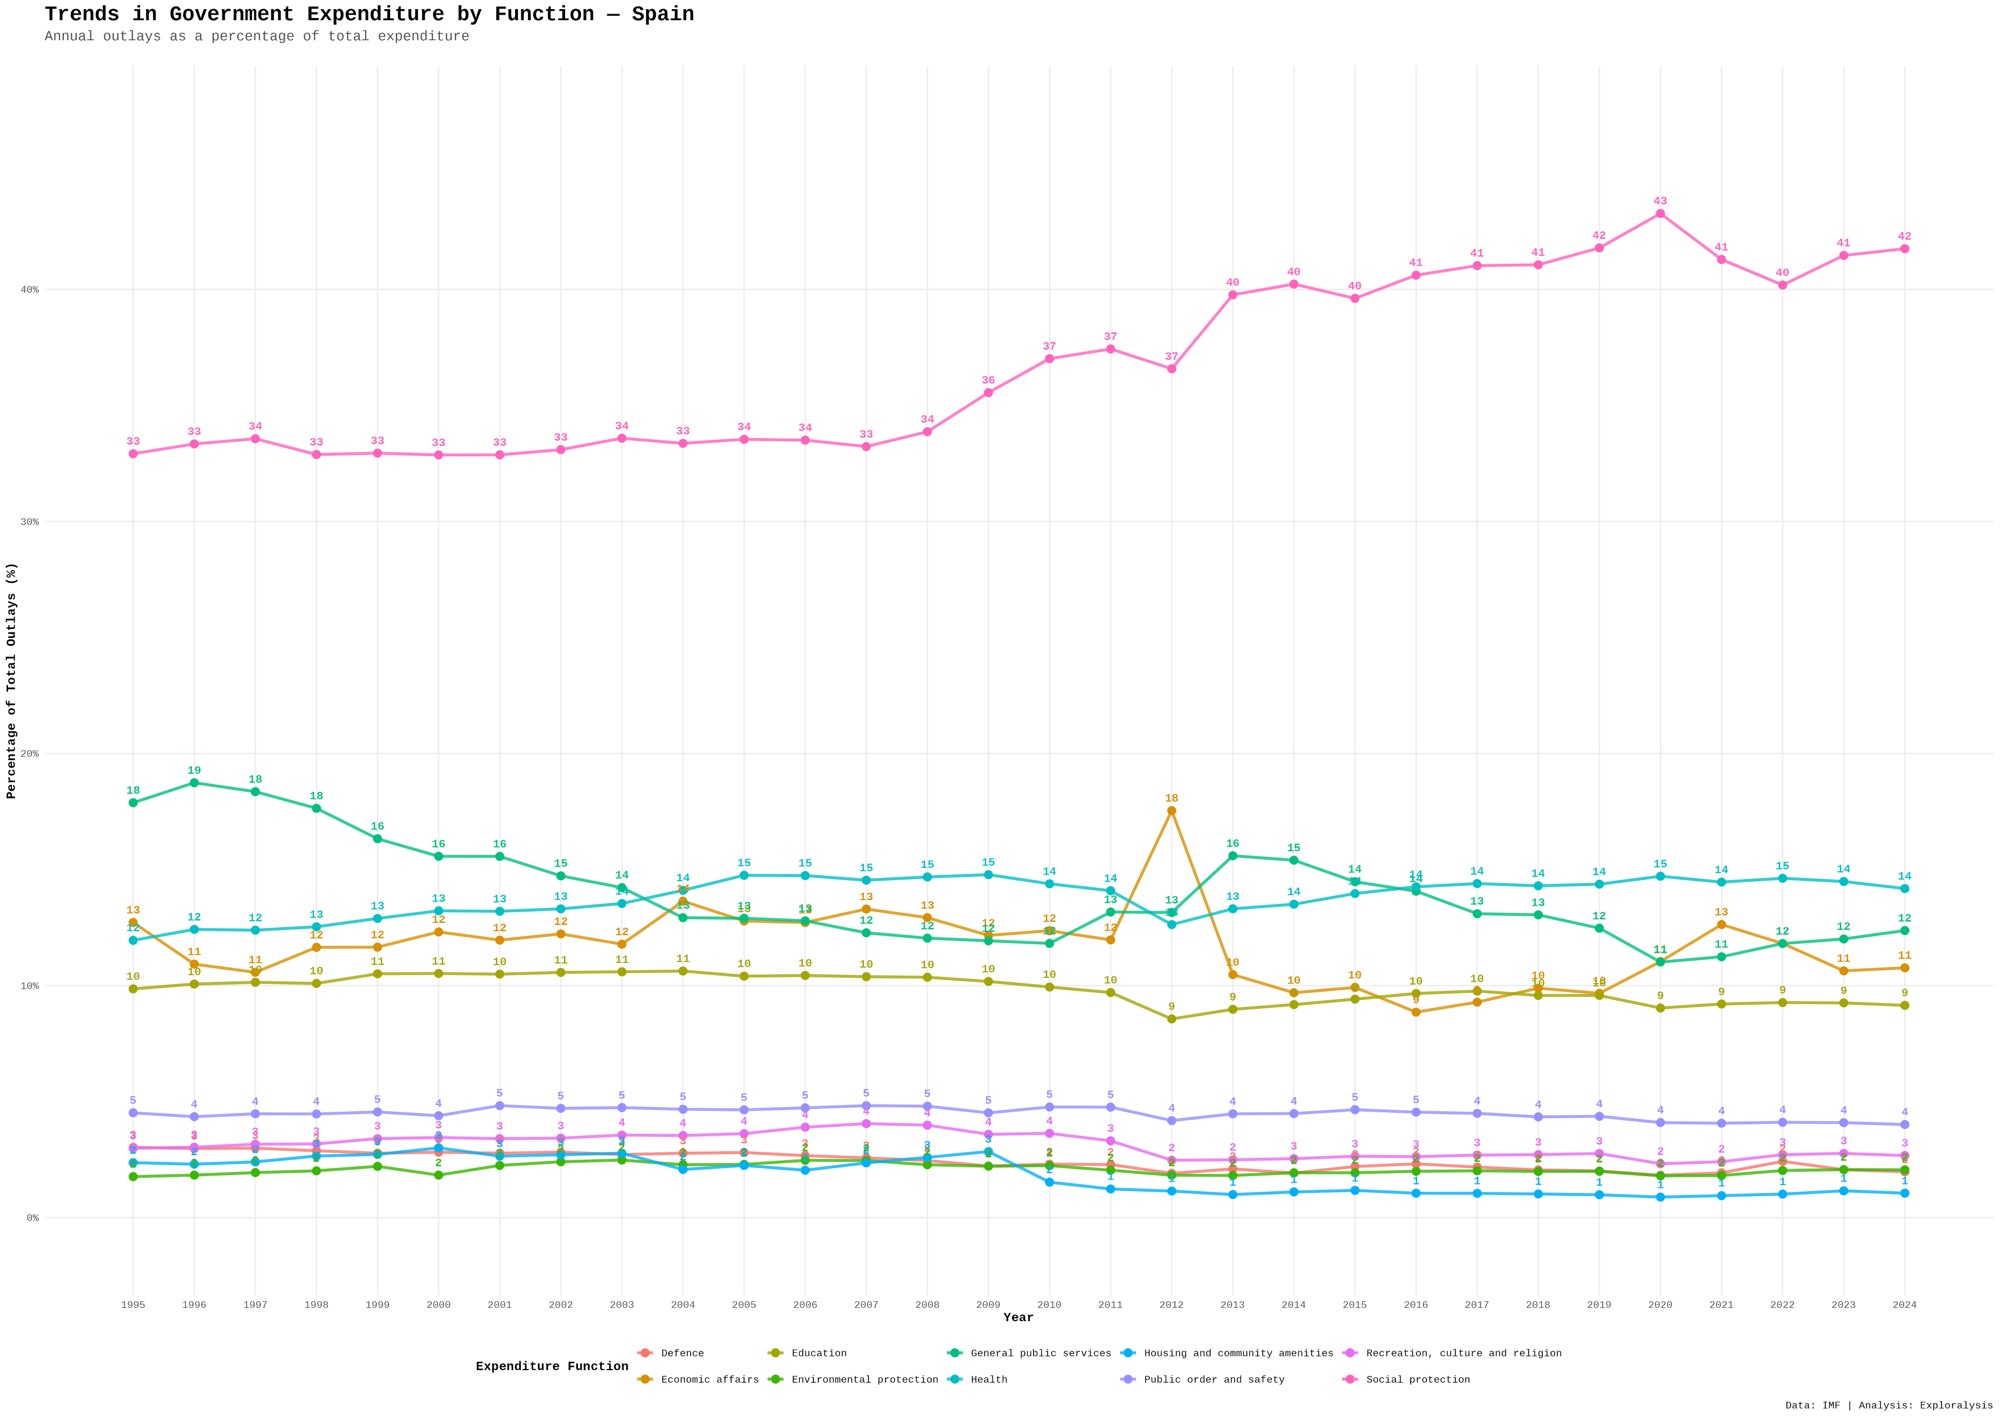
Spain’s spending structure is broadly similar to other European economies, with a strong welfare orientation and responsiveness to economic shocks.
Australia Government Spending Analysis
Australia’s data covers 1995 to 2023.
Social protection and health dominate, followed by education and general public services. Defense and economic affairs remain relatively smaller shares.
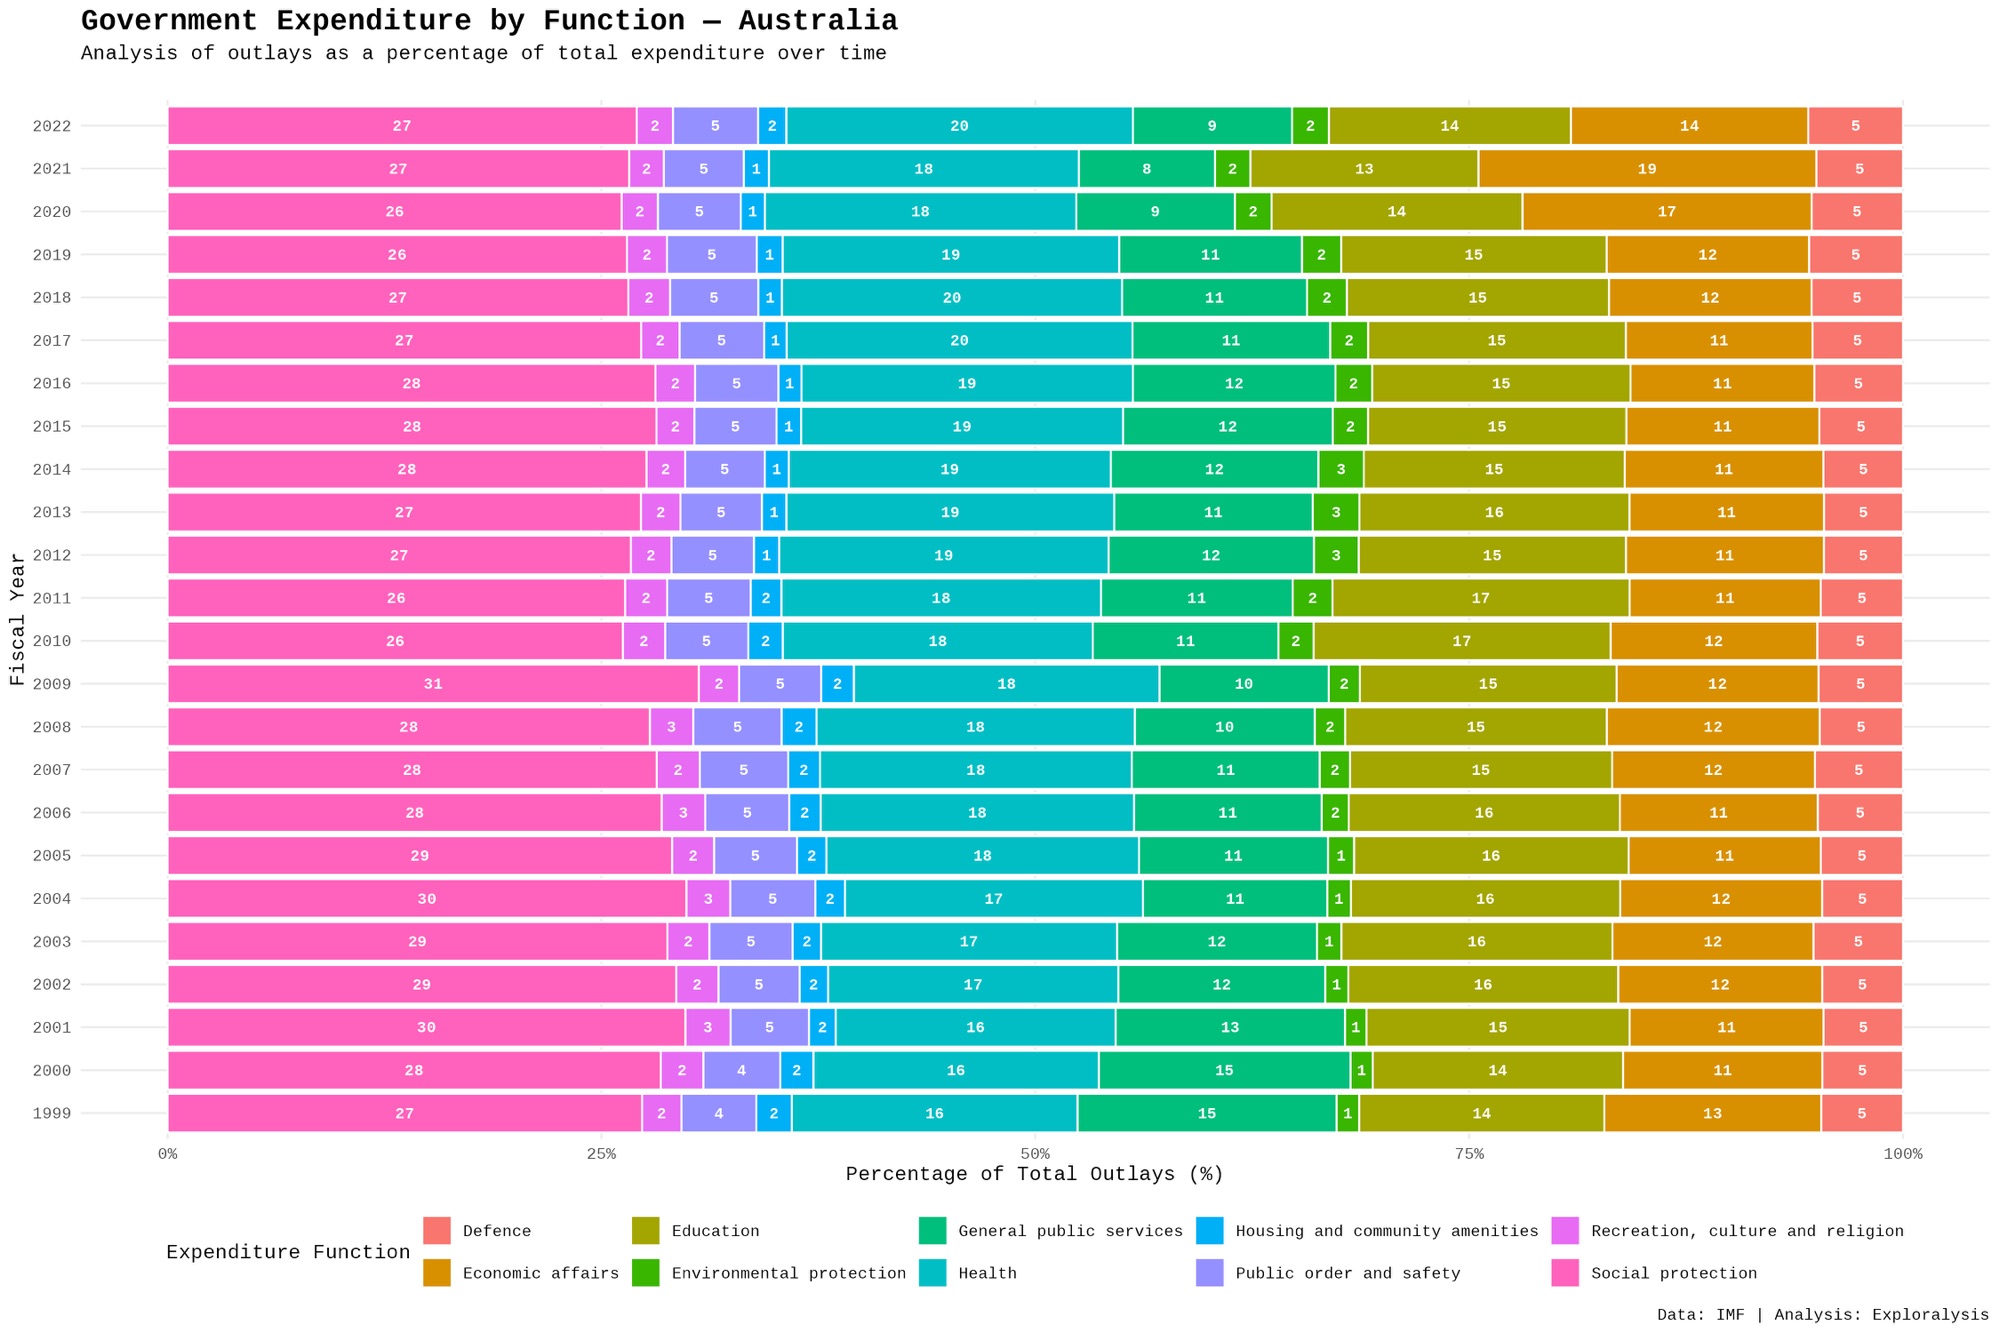
Health spending shows gradual growth, while social protection remains stable. Other categories exhibit minor fluctuations over time.
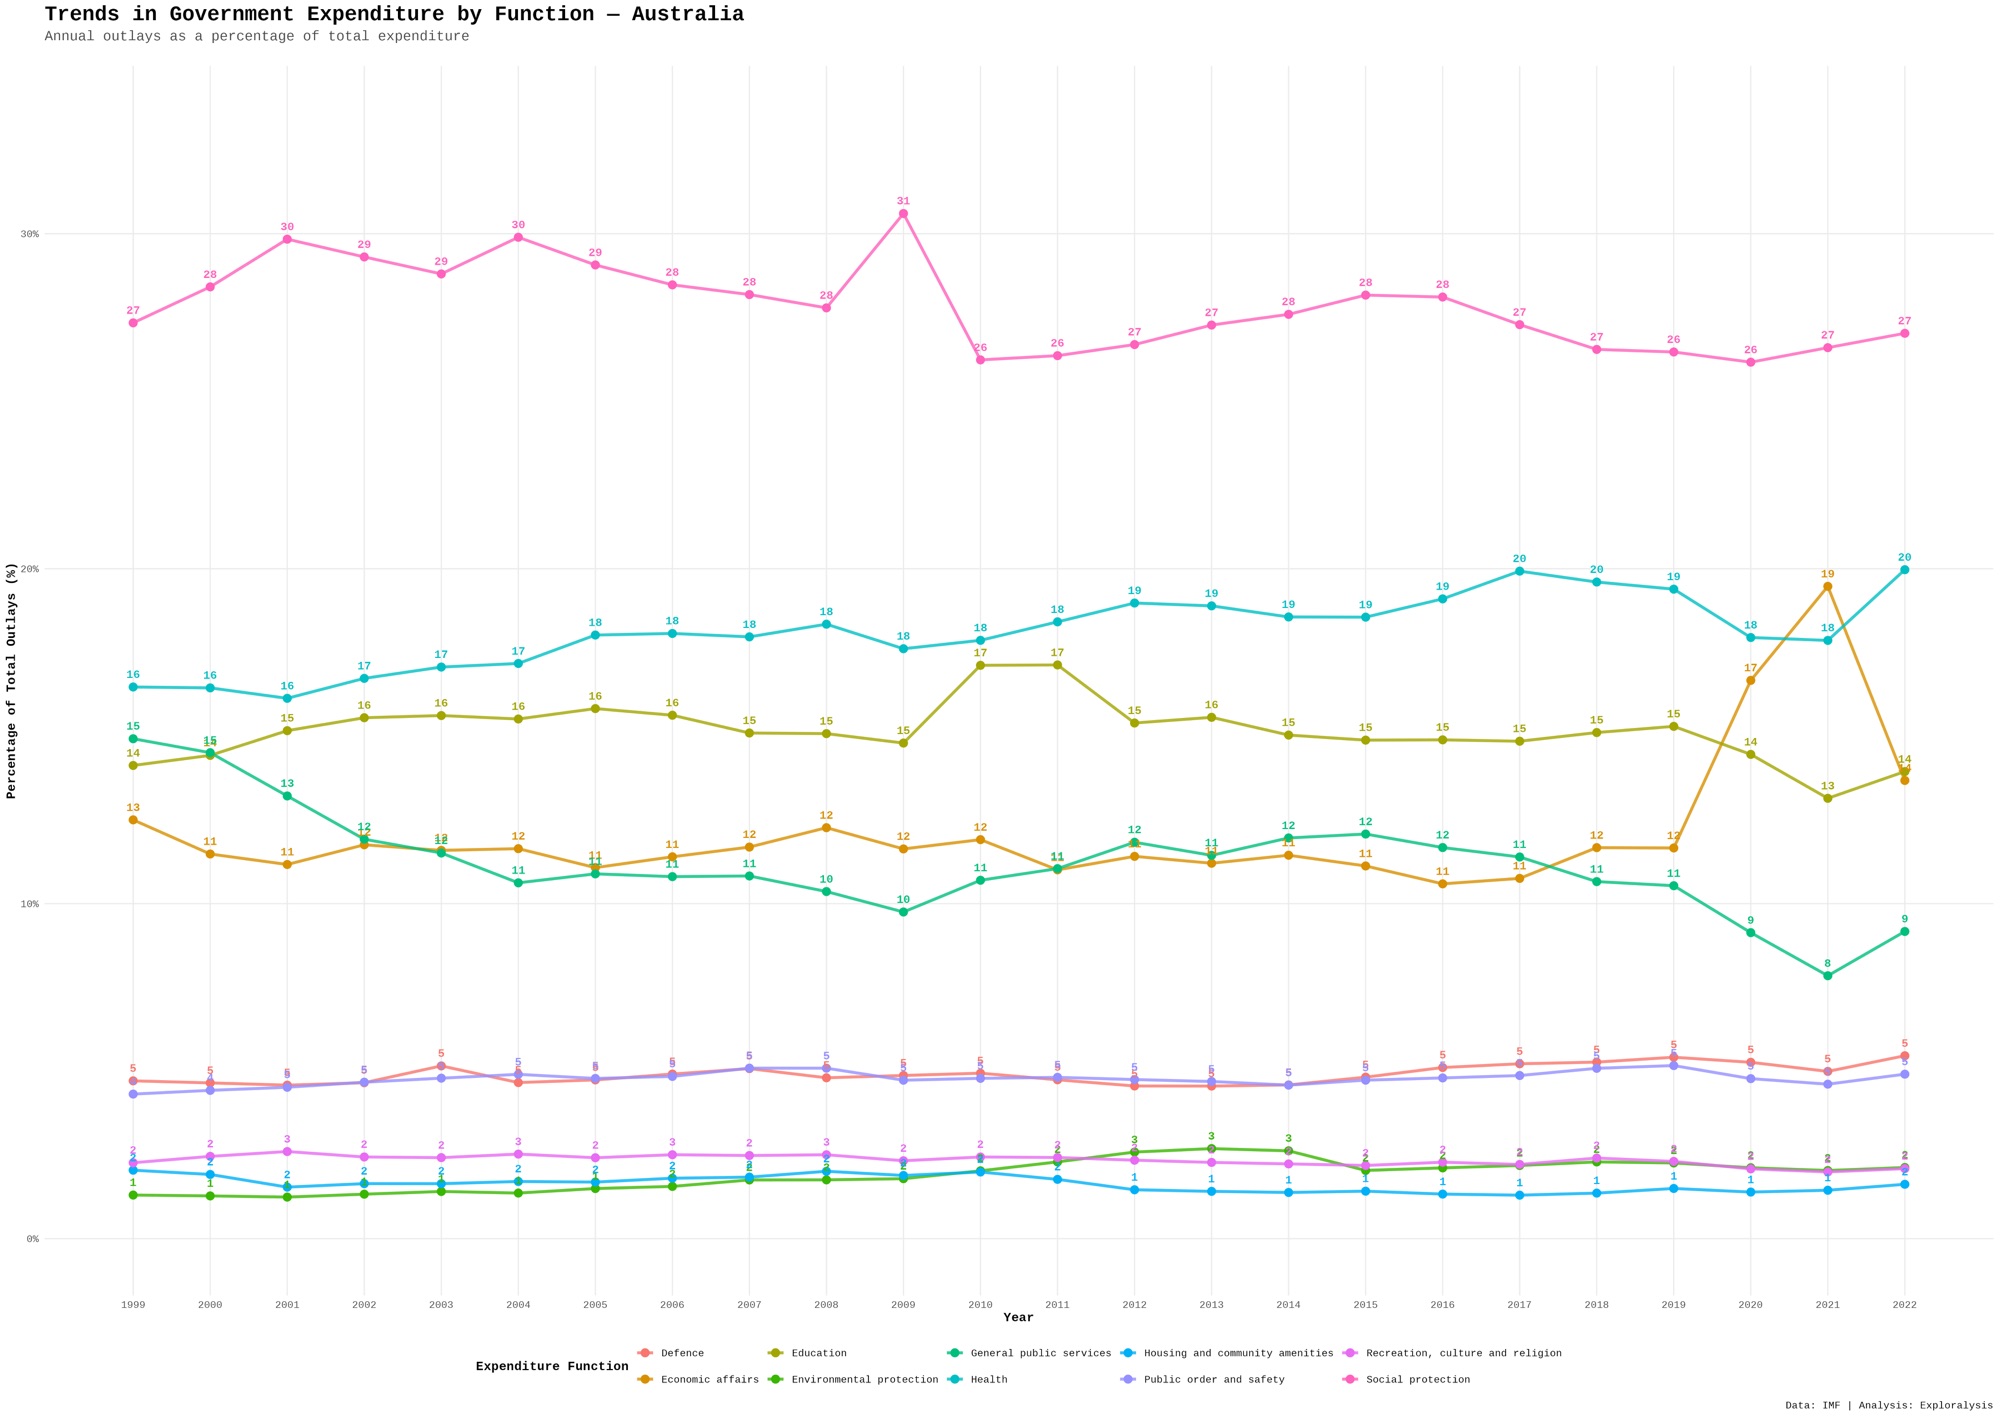
Australia’s spending reflects a balanced approach, combining welfare, healthcare, and steady investment in education.
South Korea Government Spending Analysis
South Korea’s dataset spans from 2005 to 2023.
Economic affairs plays a significant role alongside social protection and education. This reflects South Korea’s strong focus on economic development and industrial policy.
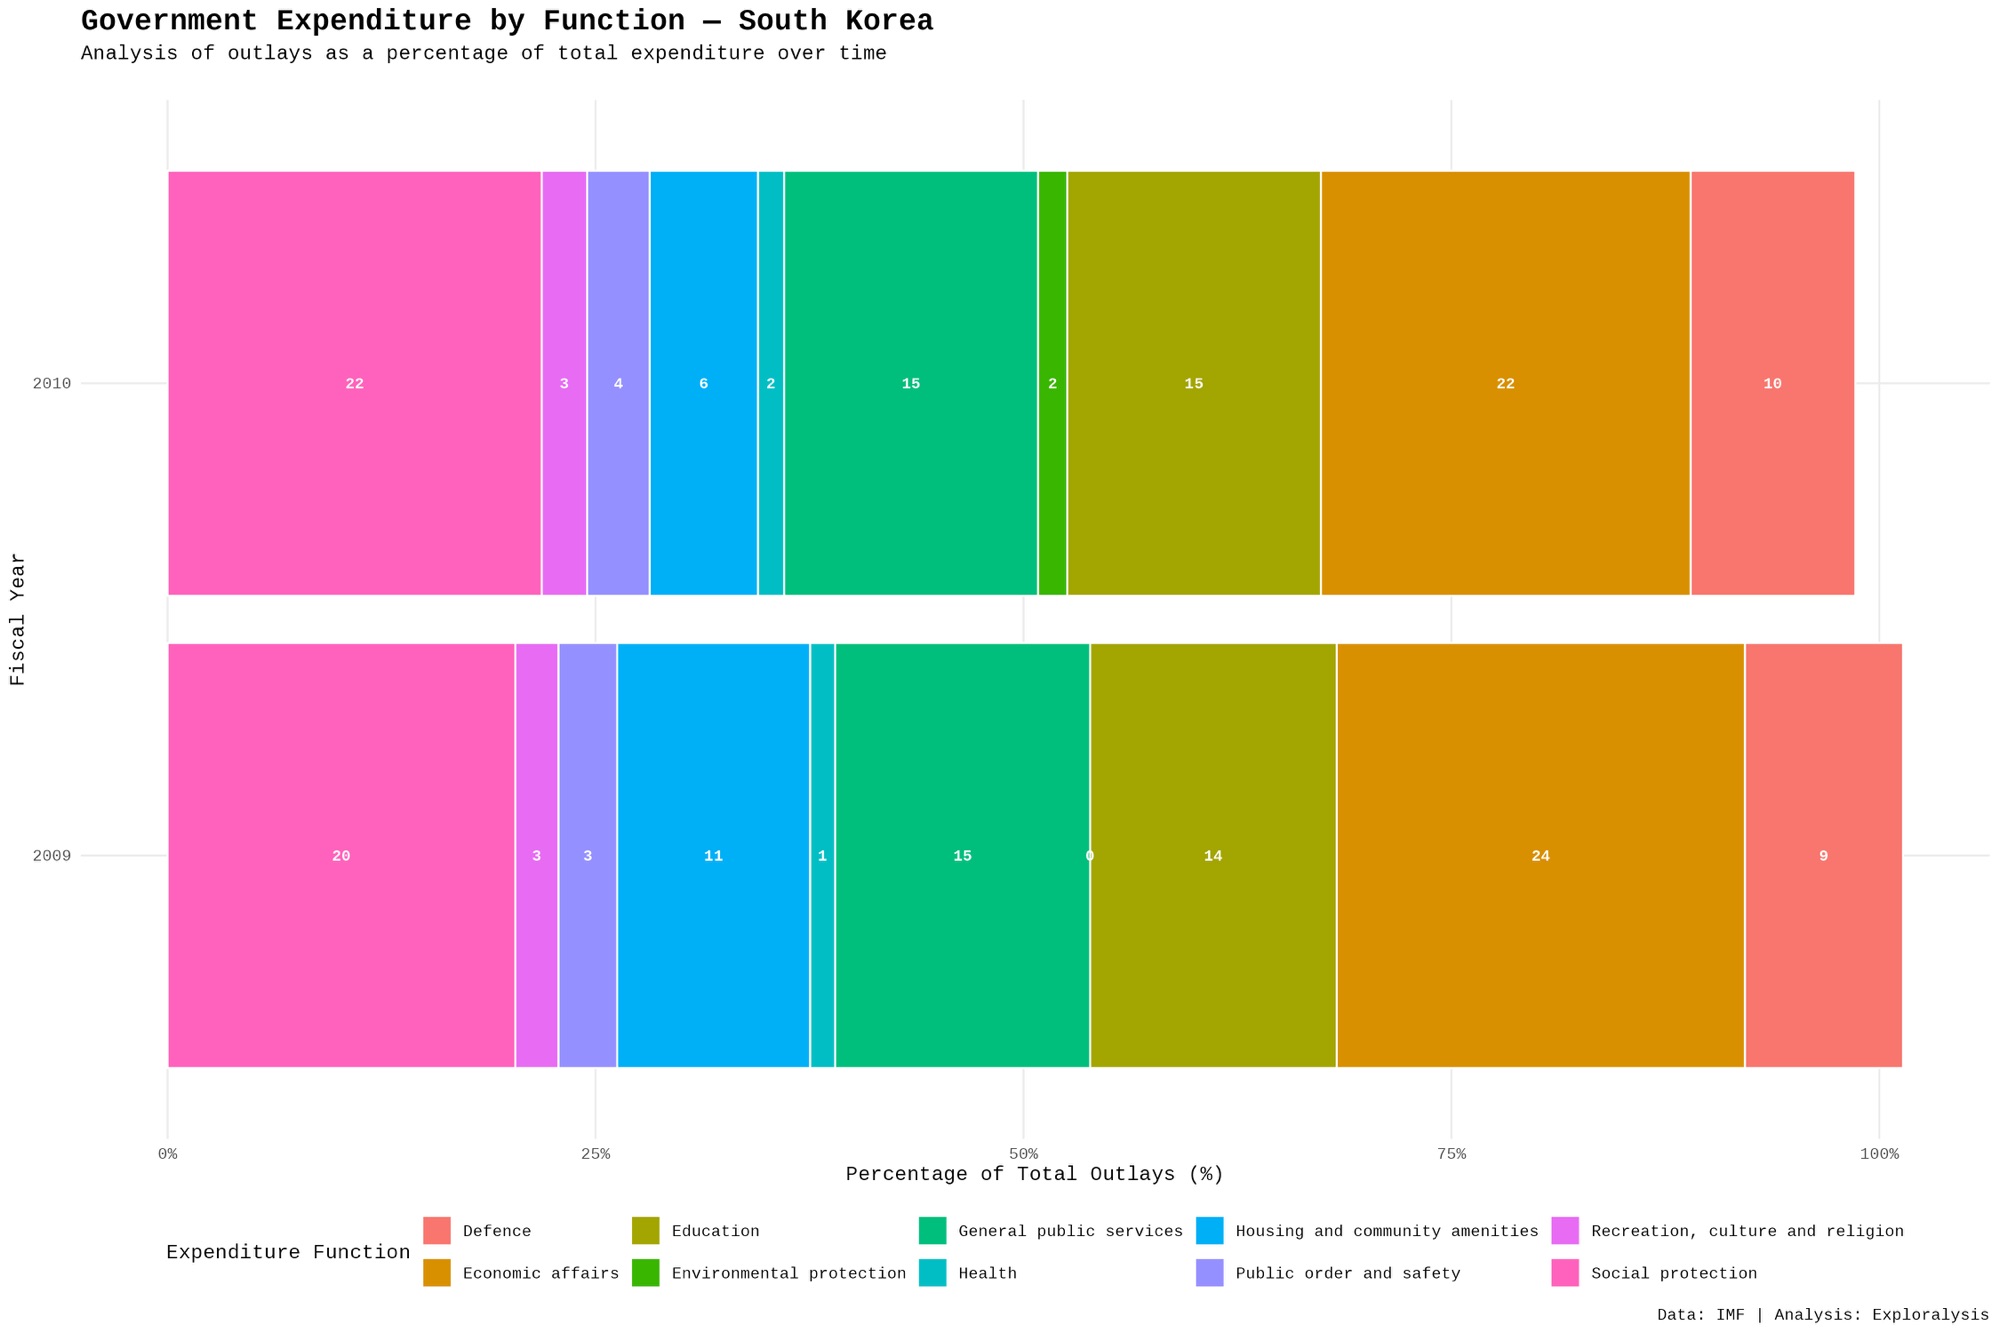
Over time, social protection increases, indicating a shift toward stronger welfare systems as the country develops. Health spending also rises gradually.
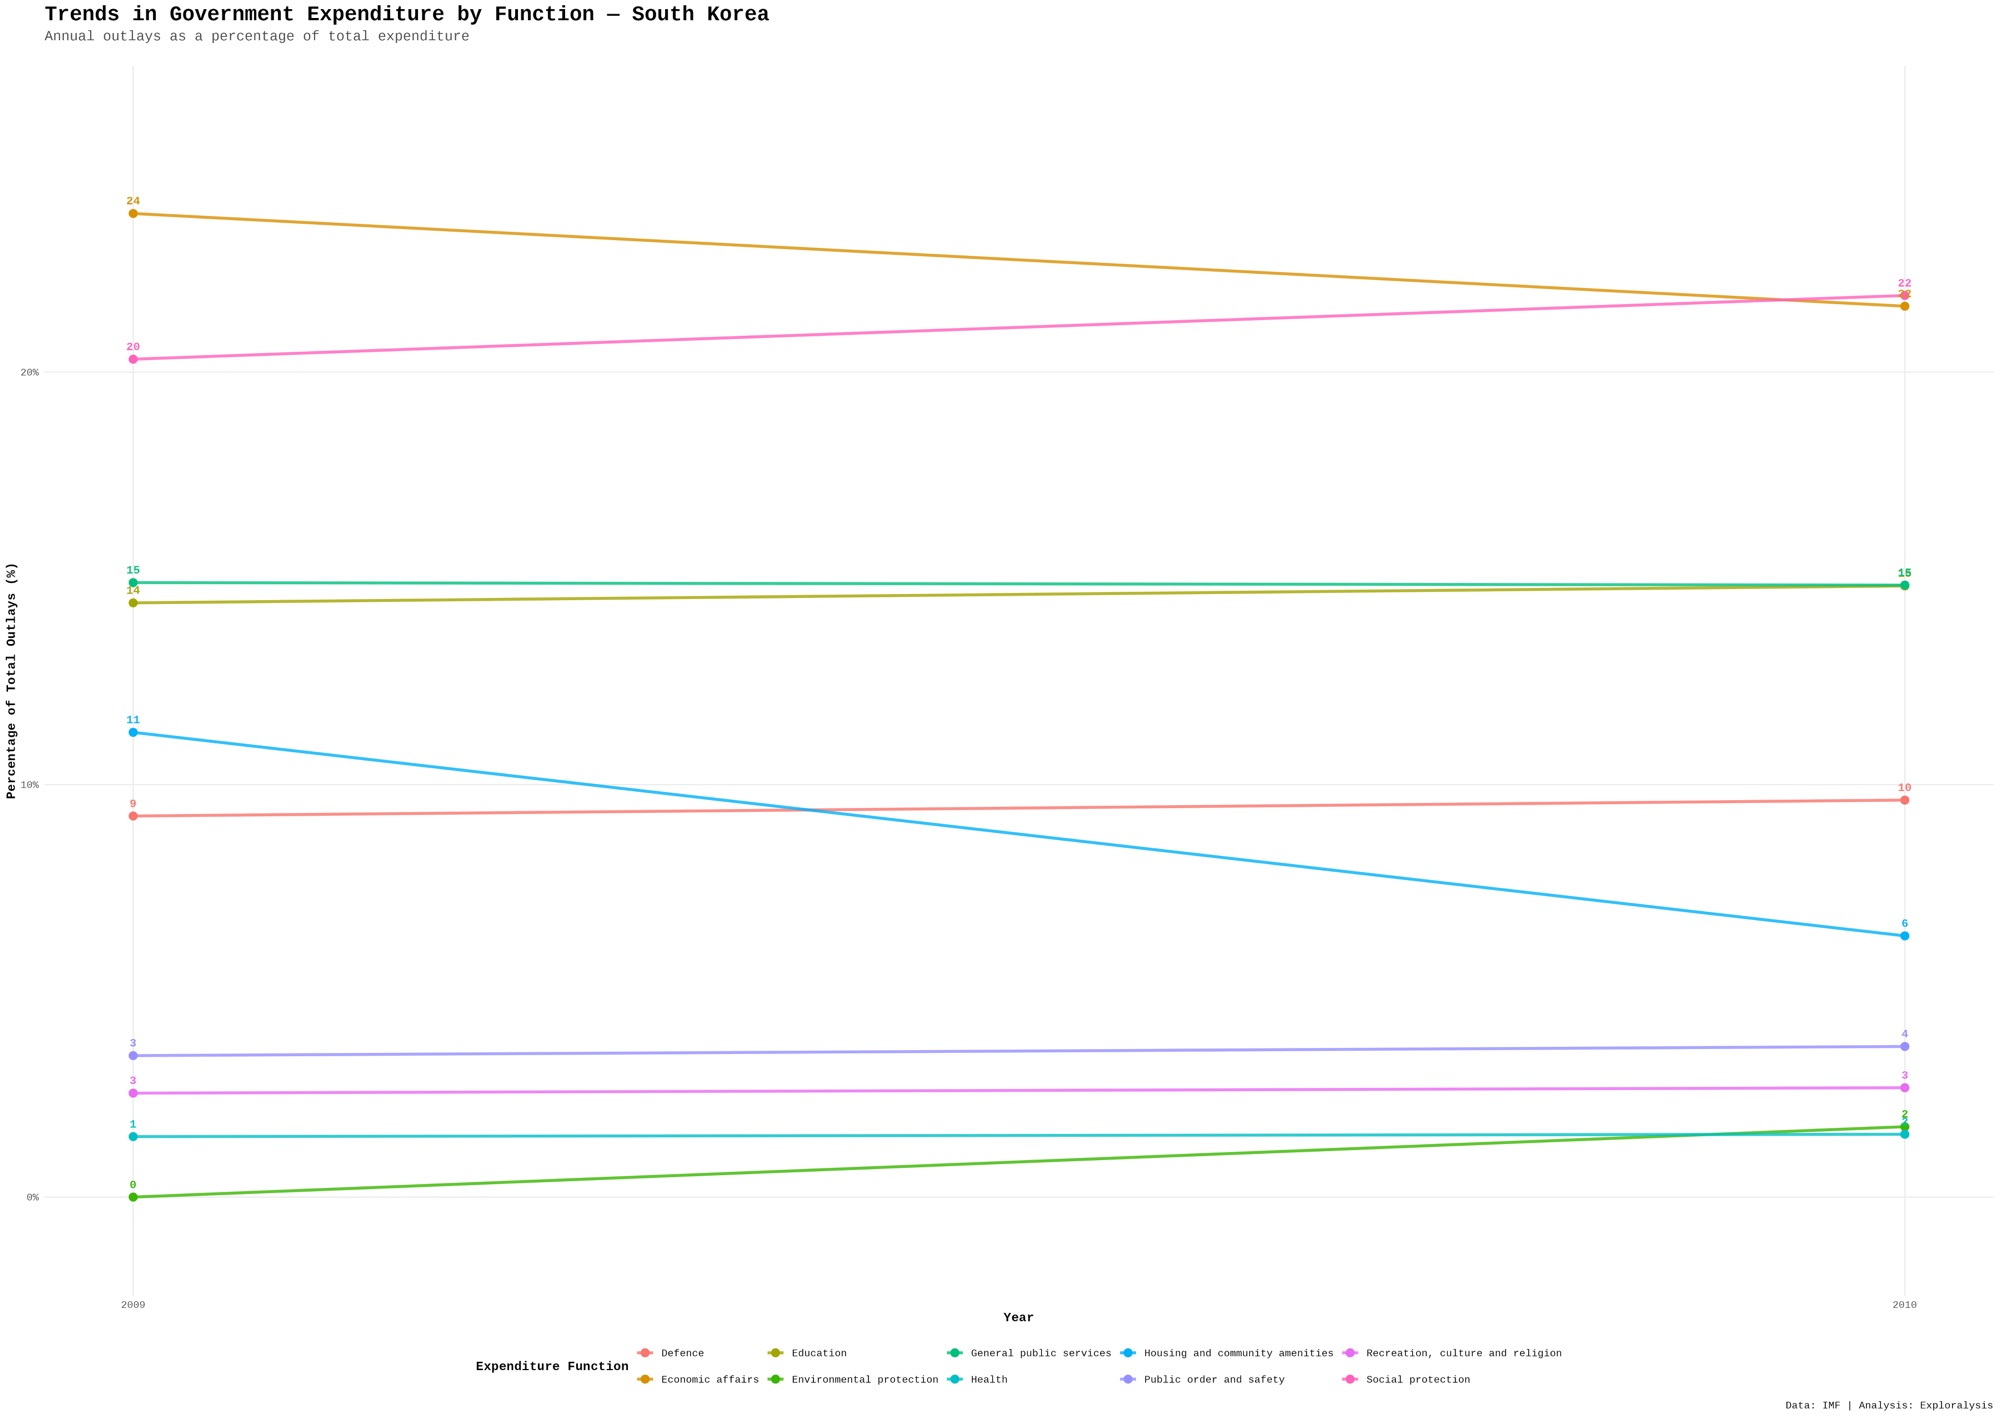
South Korea’s spending pattern highlights its transition from a development-focused economy toward a more balanced model that includes social welfare.
Turkey Government Spending Analysis
Turkey’s data covers 2006 to 2023.
Economic affairs and social protection dominate, followed by general public services and education. Defense also plays a notable role.
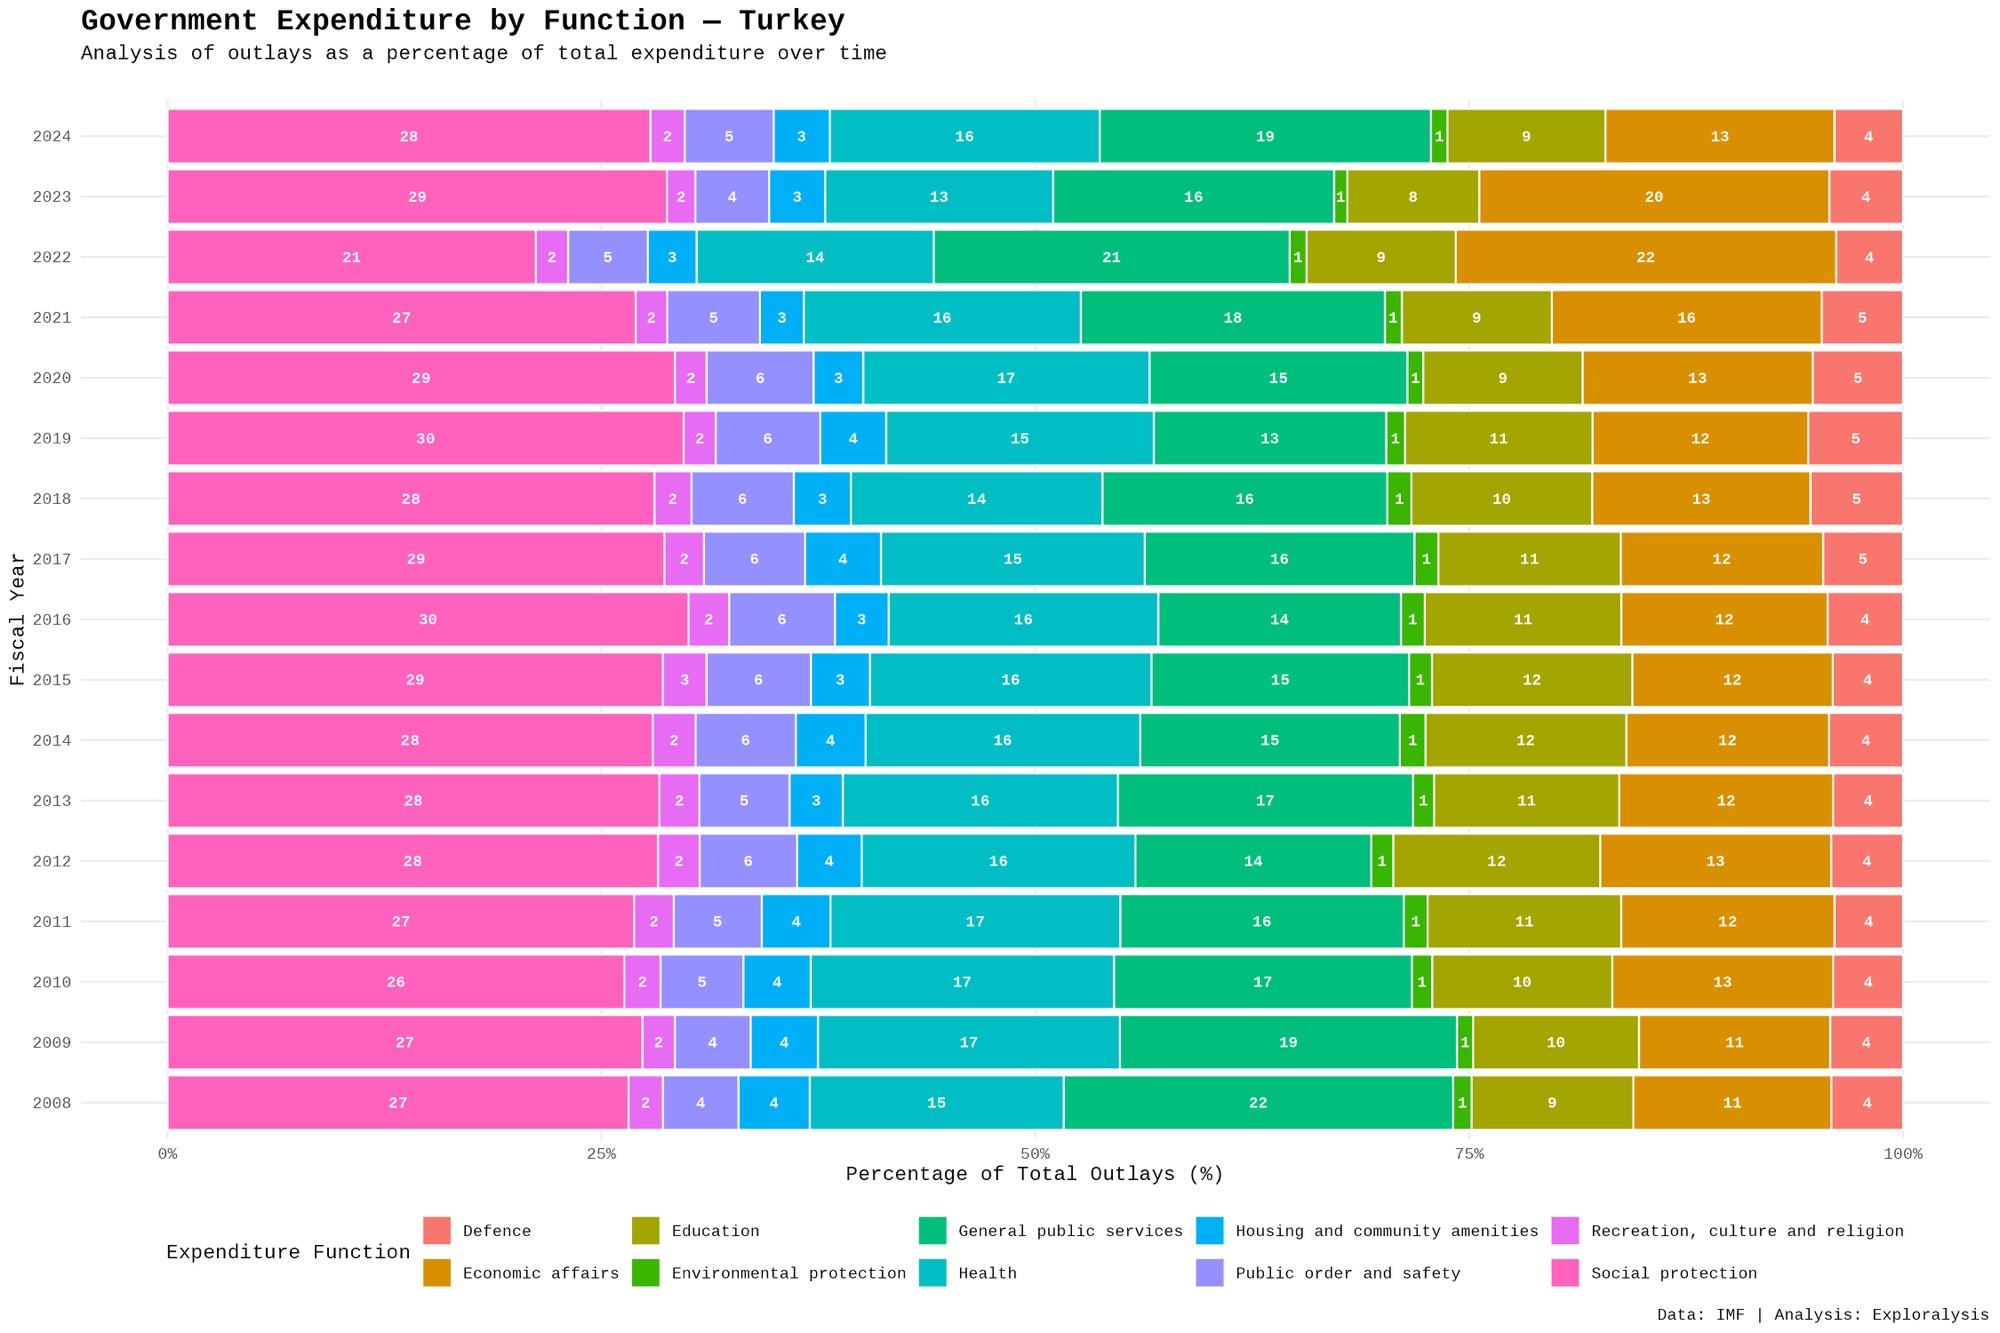
Spending patterns show variability, with shifts between categories depending on economic conditions and policy priorities.
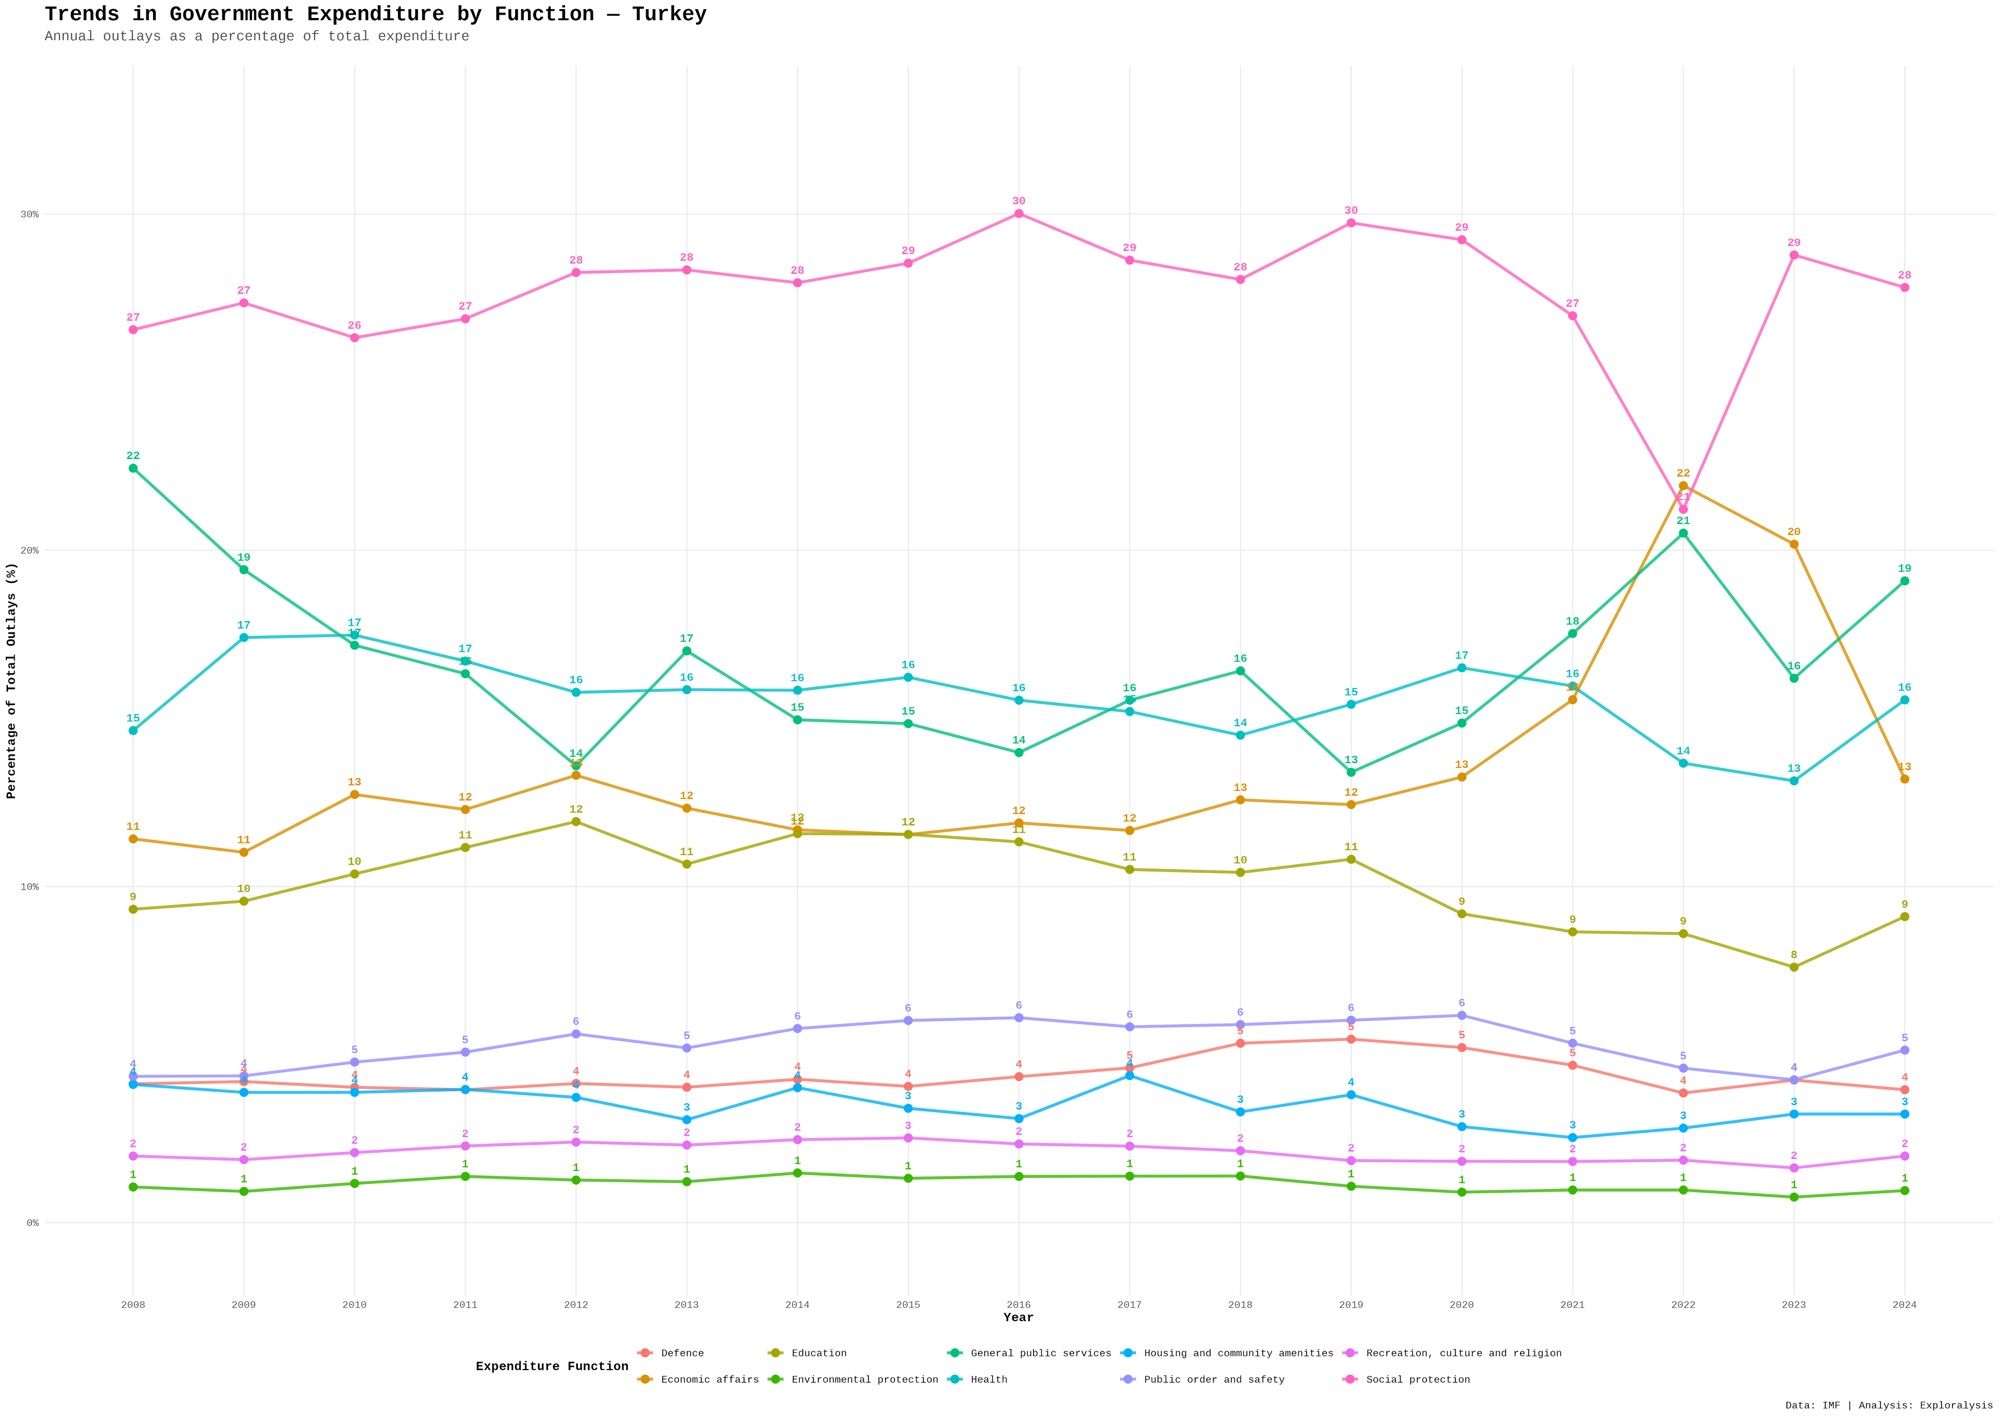
Turkey’s profile reflects a mix of development-oriented spending and social support, with some emphasis on security-related expenditures.
Indonesia Government Spending Analysis
Indonesia’s dataset spans from 2005 to 2023.
Economic affairs plays a major role, reflecting infrastructure development and economic growth priorities. Social protection and education follow, with health gradually increasing.
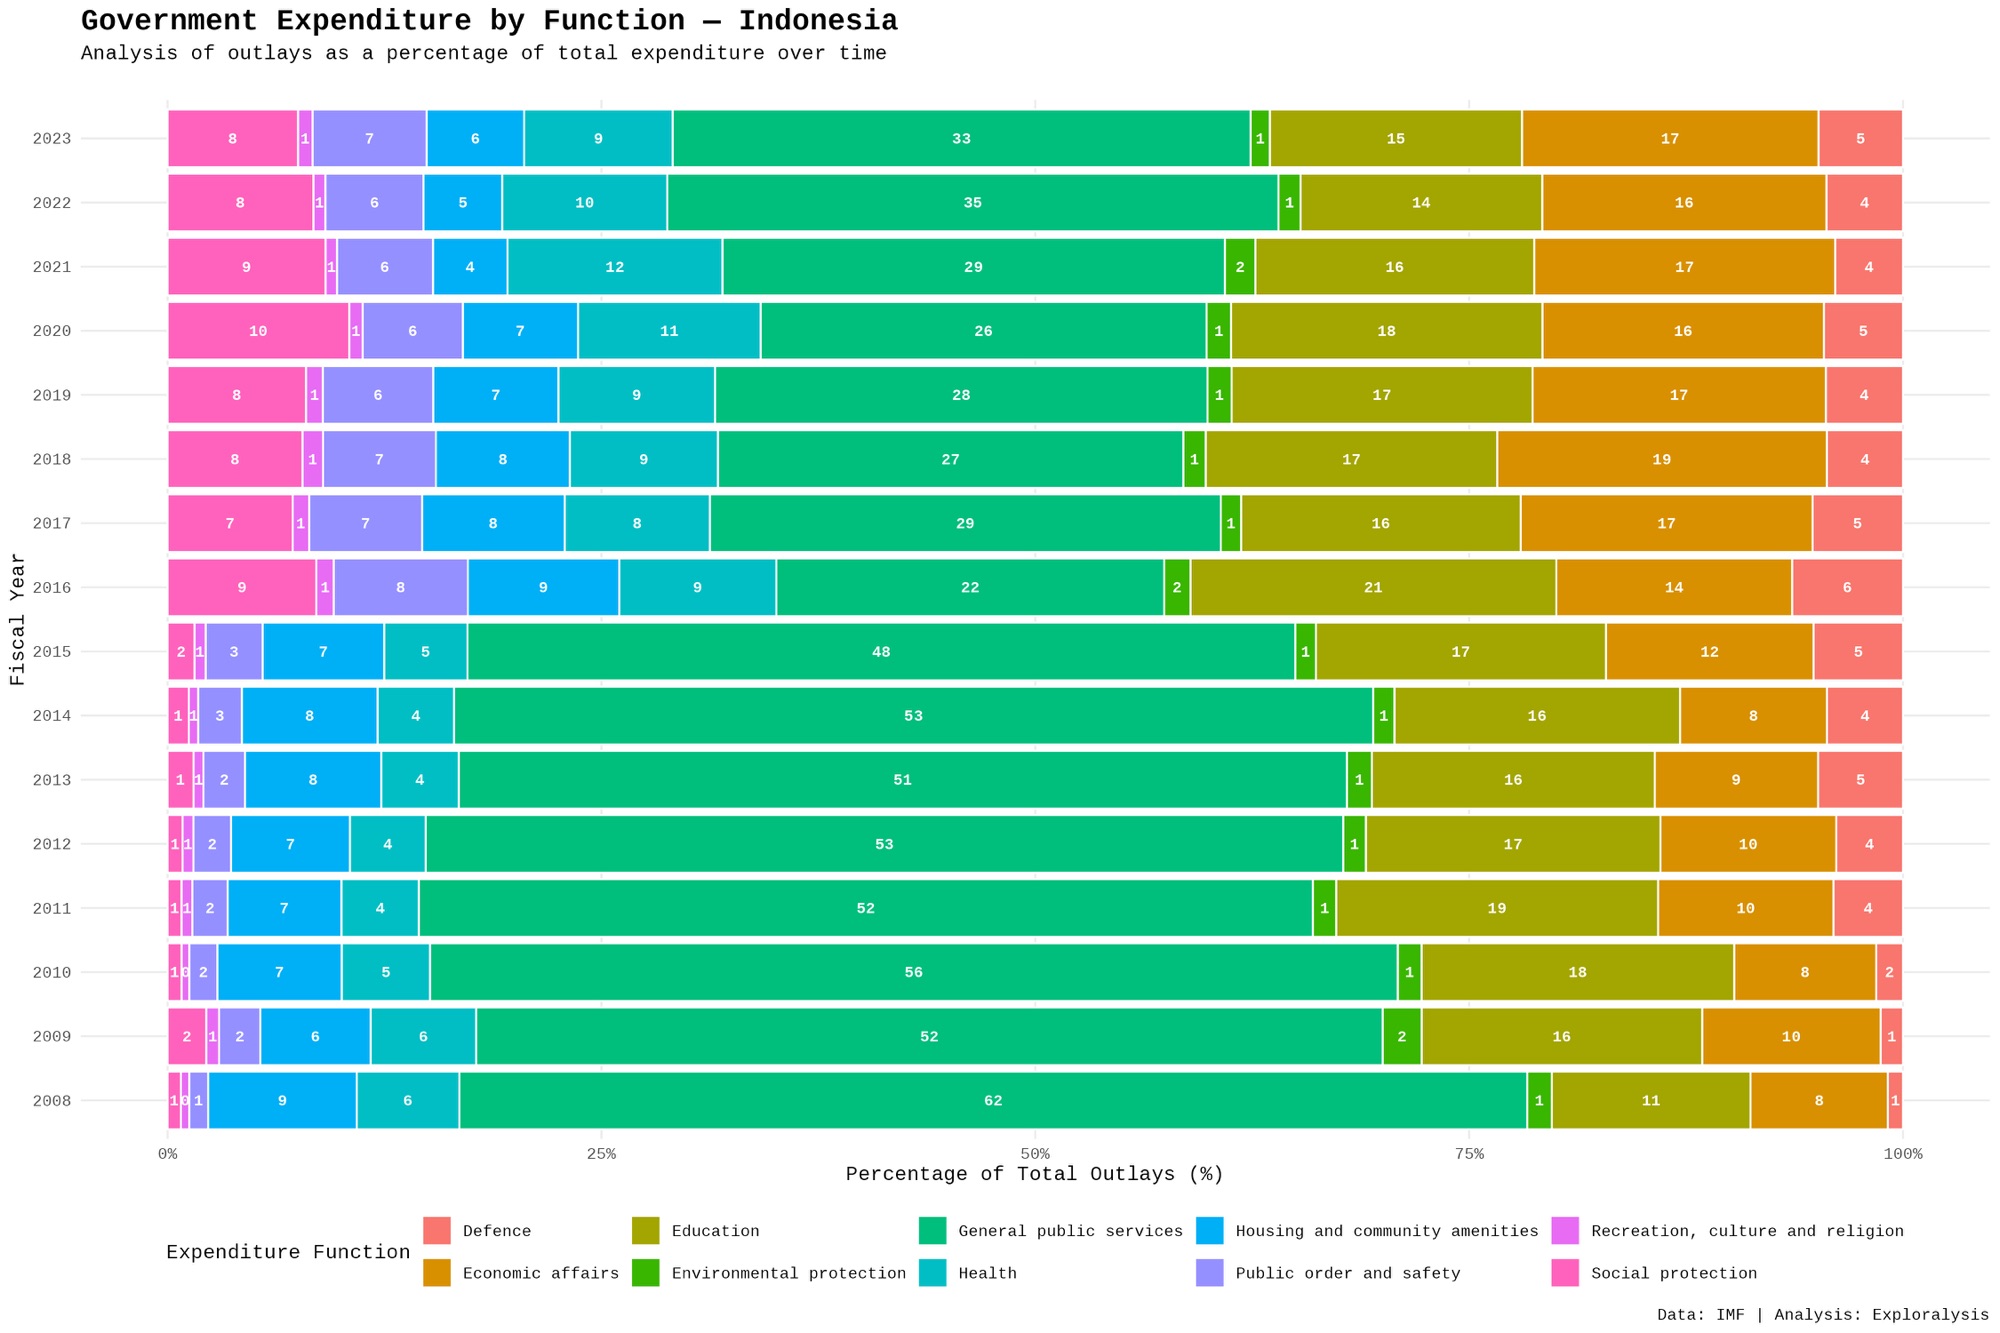
Over time, social protection rises, indicating growing attention to welfare programs. Health and education also show steady improvements.
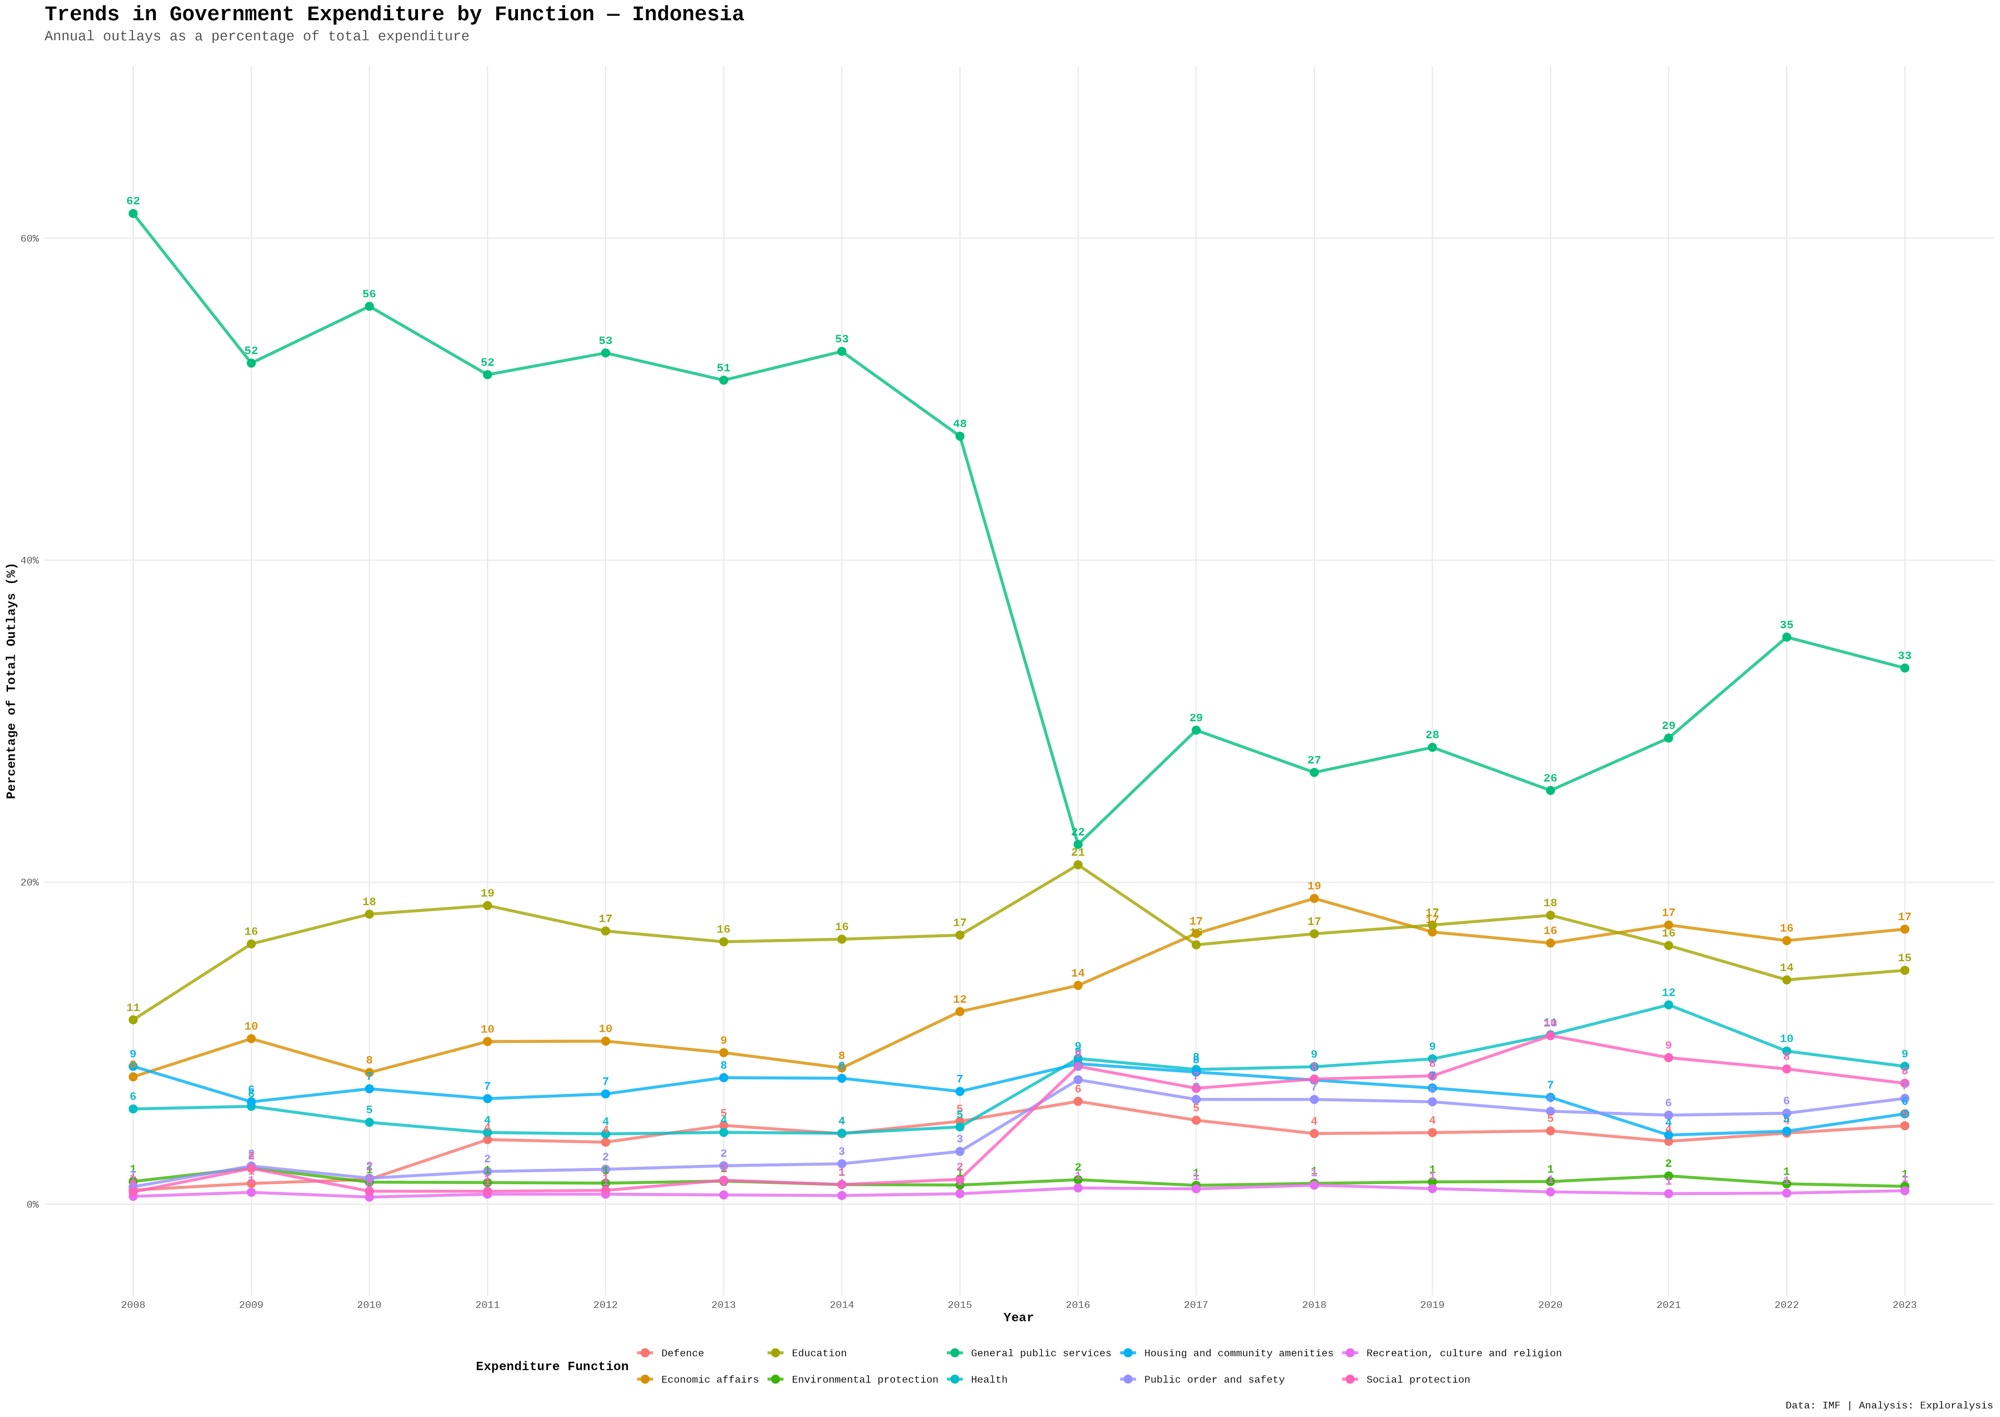
Indonesia’s spending pattern reflects a developing economy balancing growth investments with expanding social services.
Netherlands Government Spending Analysis
The Netherlands’ data covers 1995 to 2023.
Social protection dominates, followed by health and general public services. Education and economic affairs remain stable secondary categories.
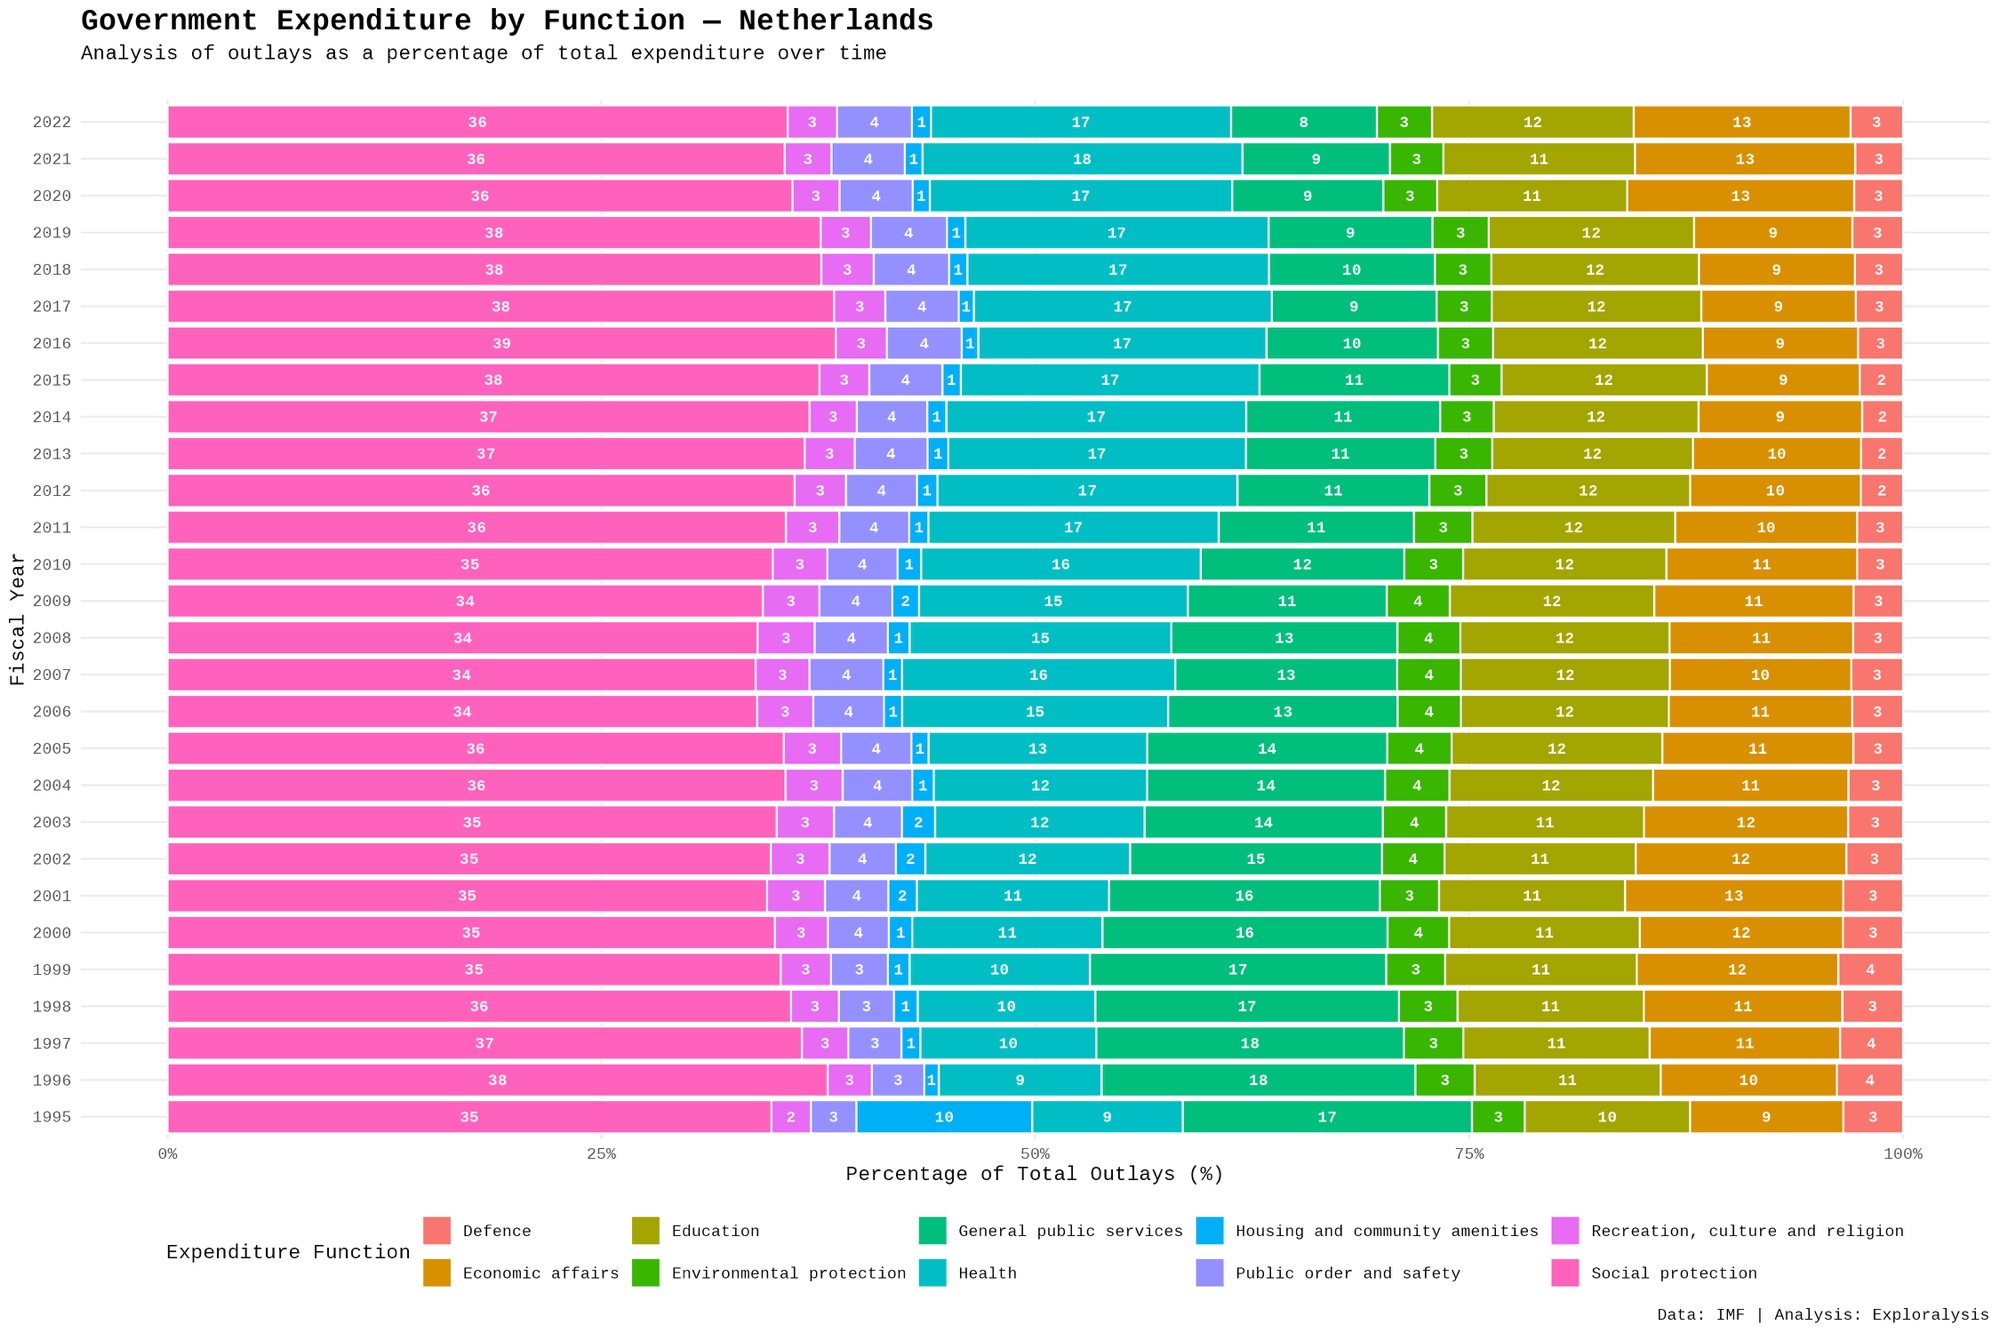
Spending patterns are highly stable over time, with gradual increases in health and social protection.
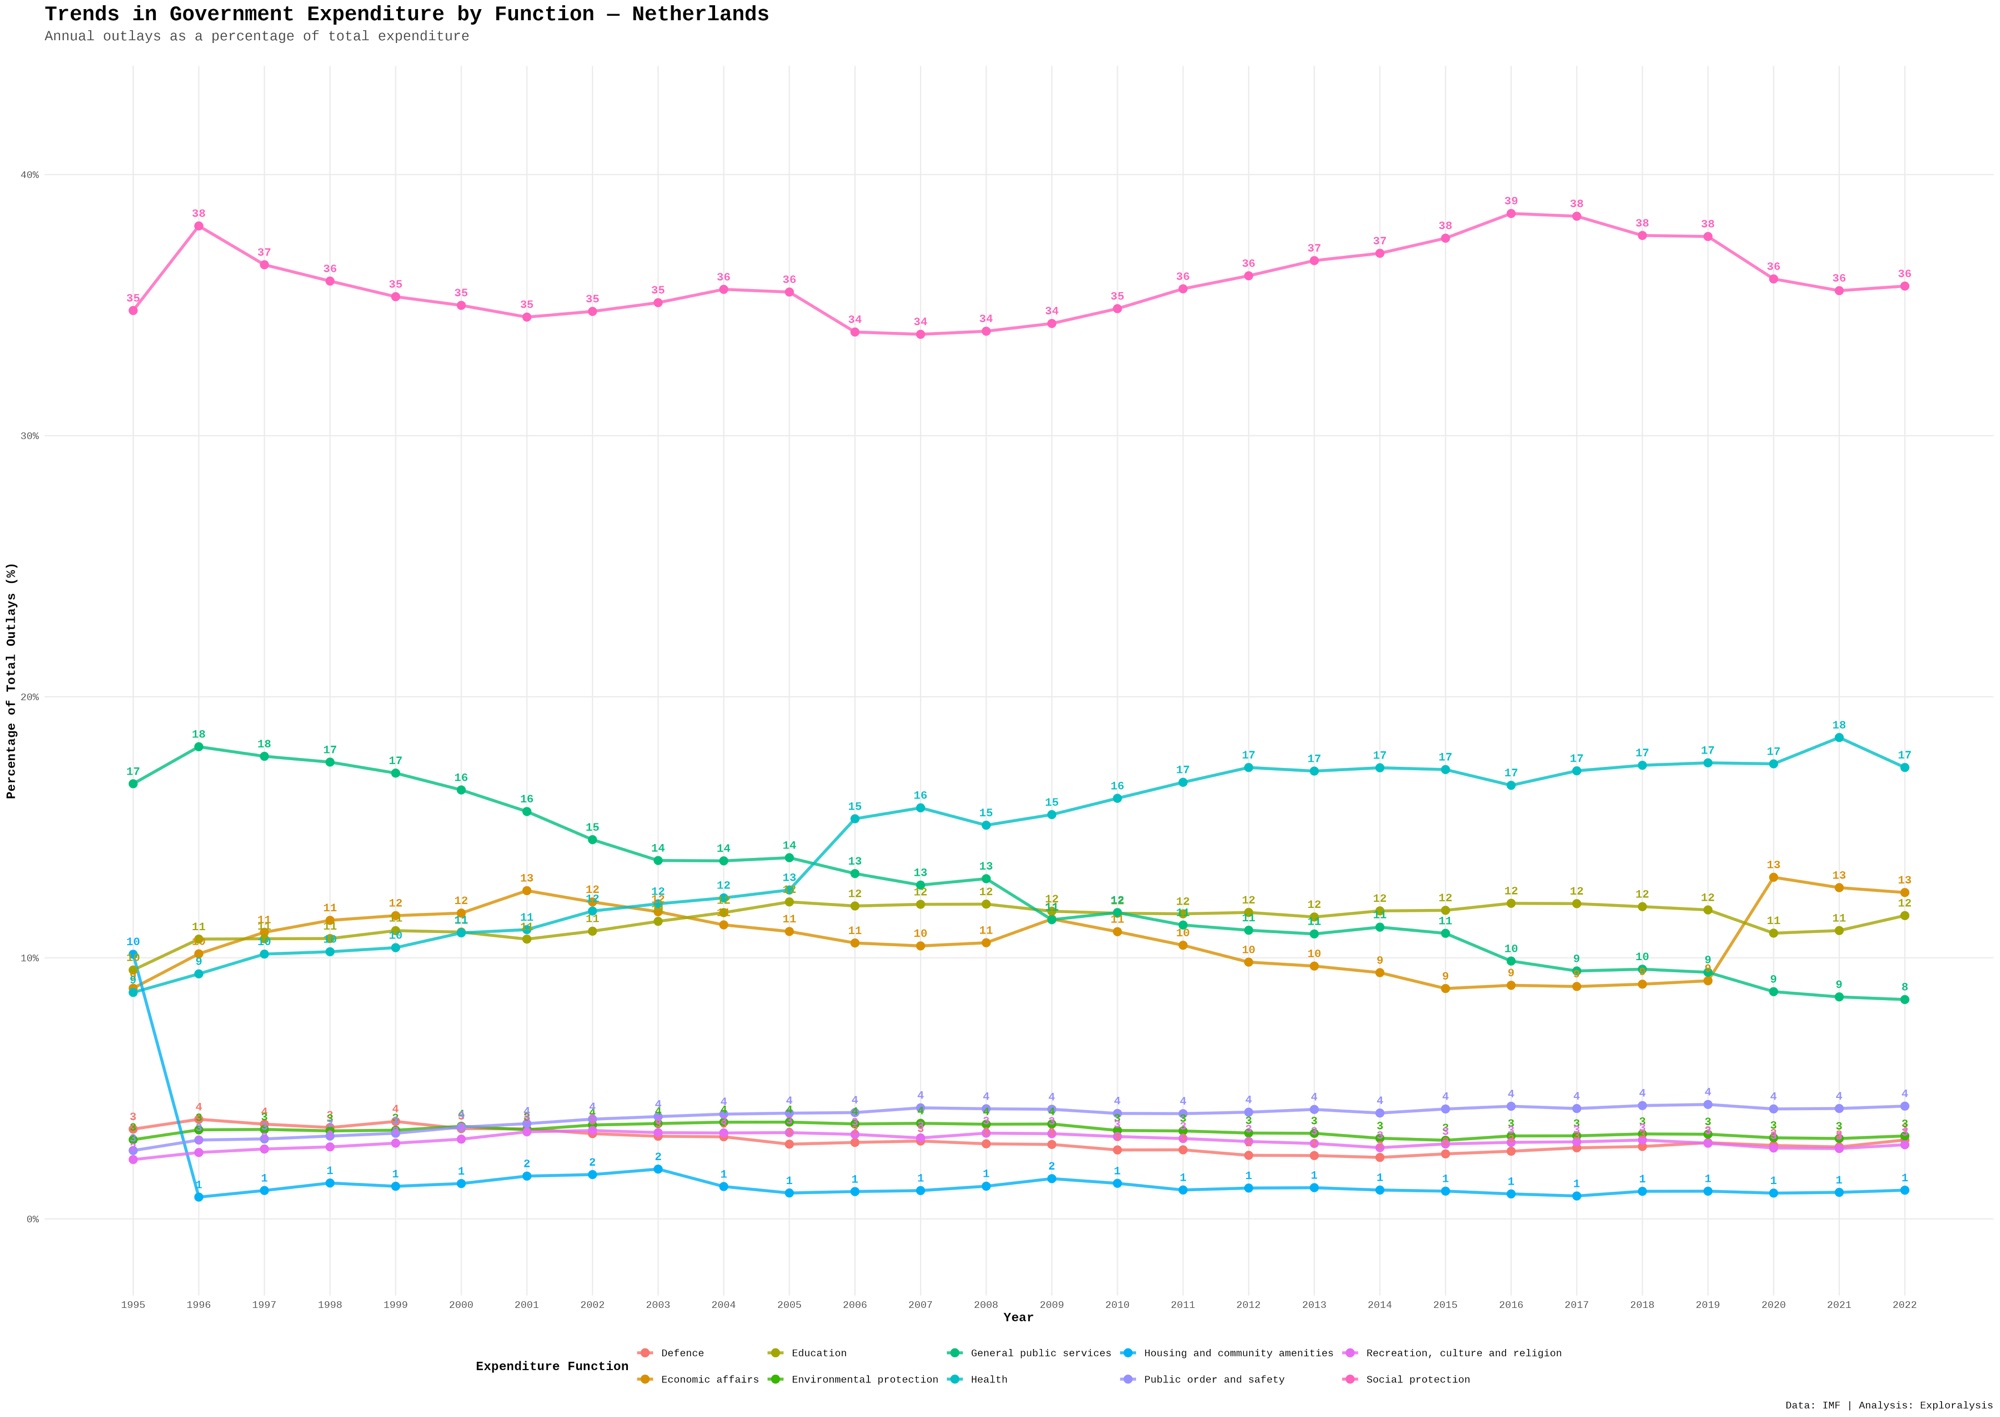
The Netherlands reflects a mature welfare state with consistent policy priorities and strong social support systems.
Poland Government Spending Analysis
Poland’s dataset spans from 1995 to 2023.
Social protection leads, followed by health, education, and economic affairs. General public services also play a consistent role.
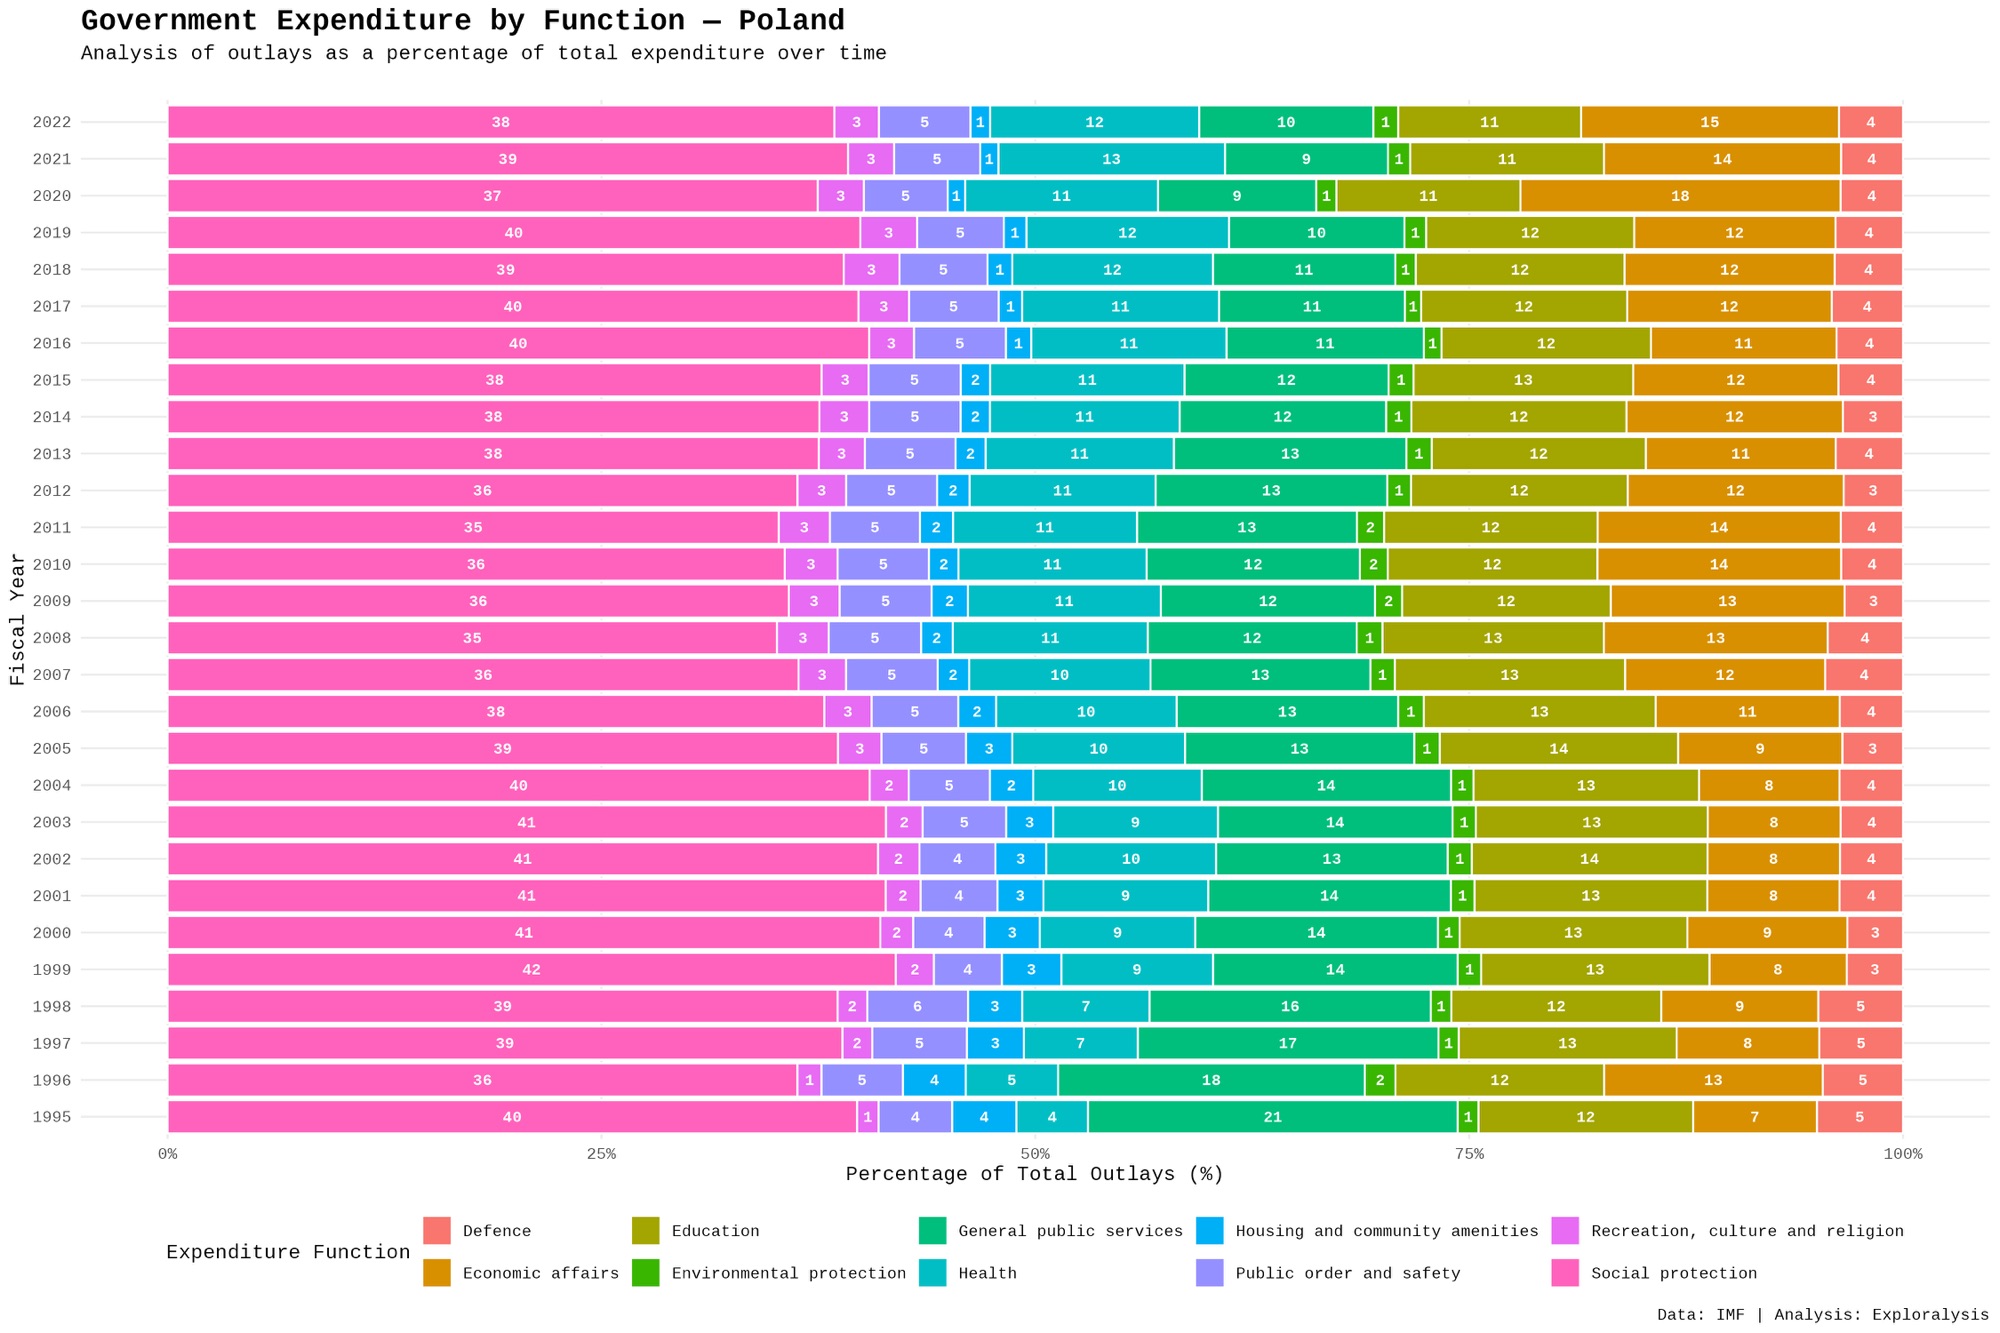
Over time, social protection and health increase gradually, while other categories remain relatively stable.
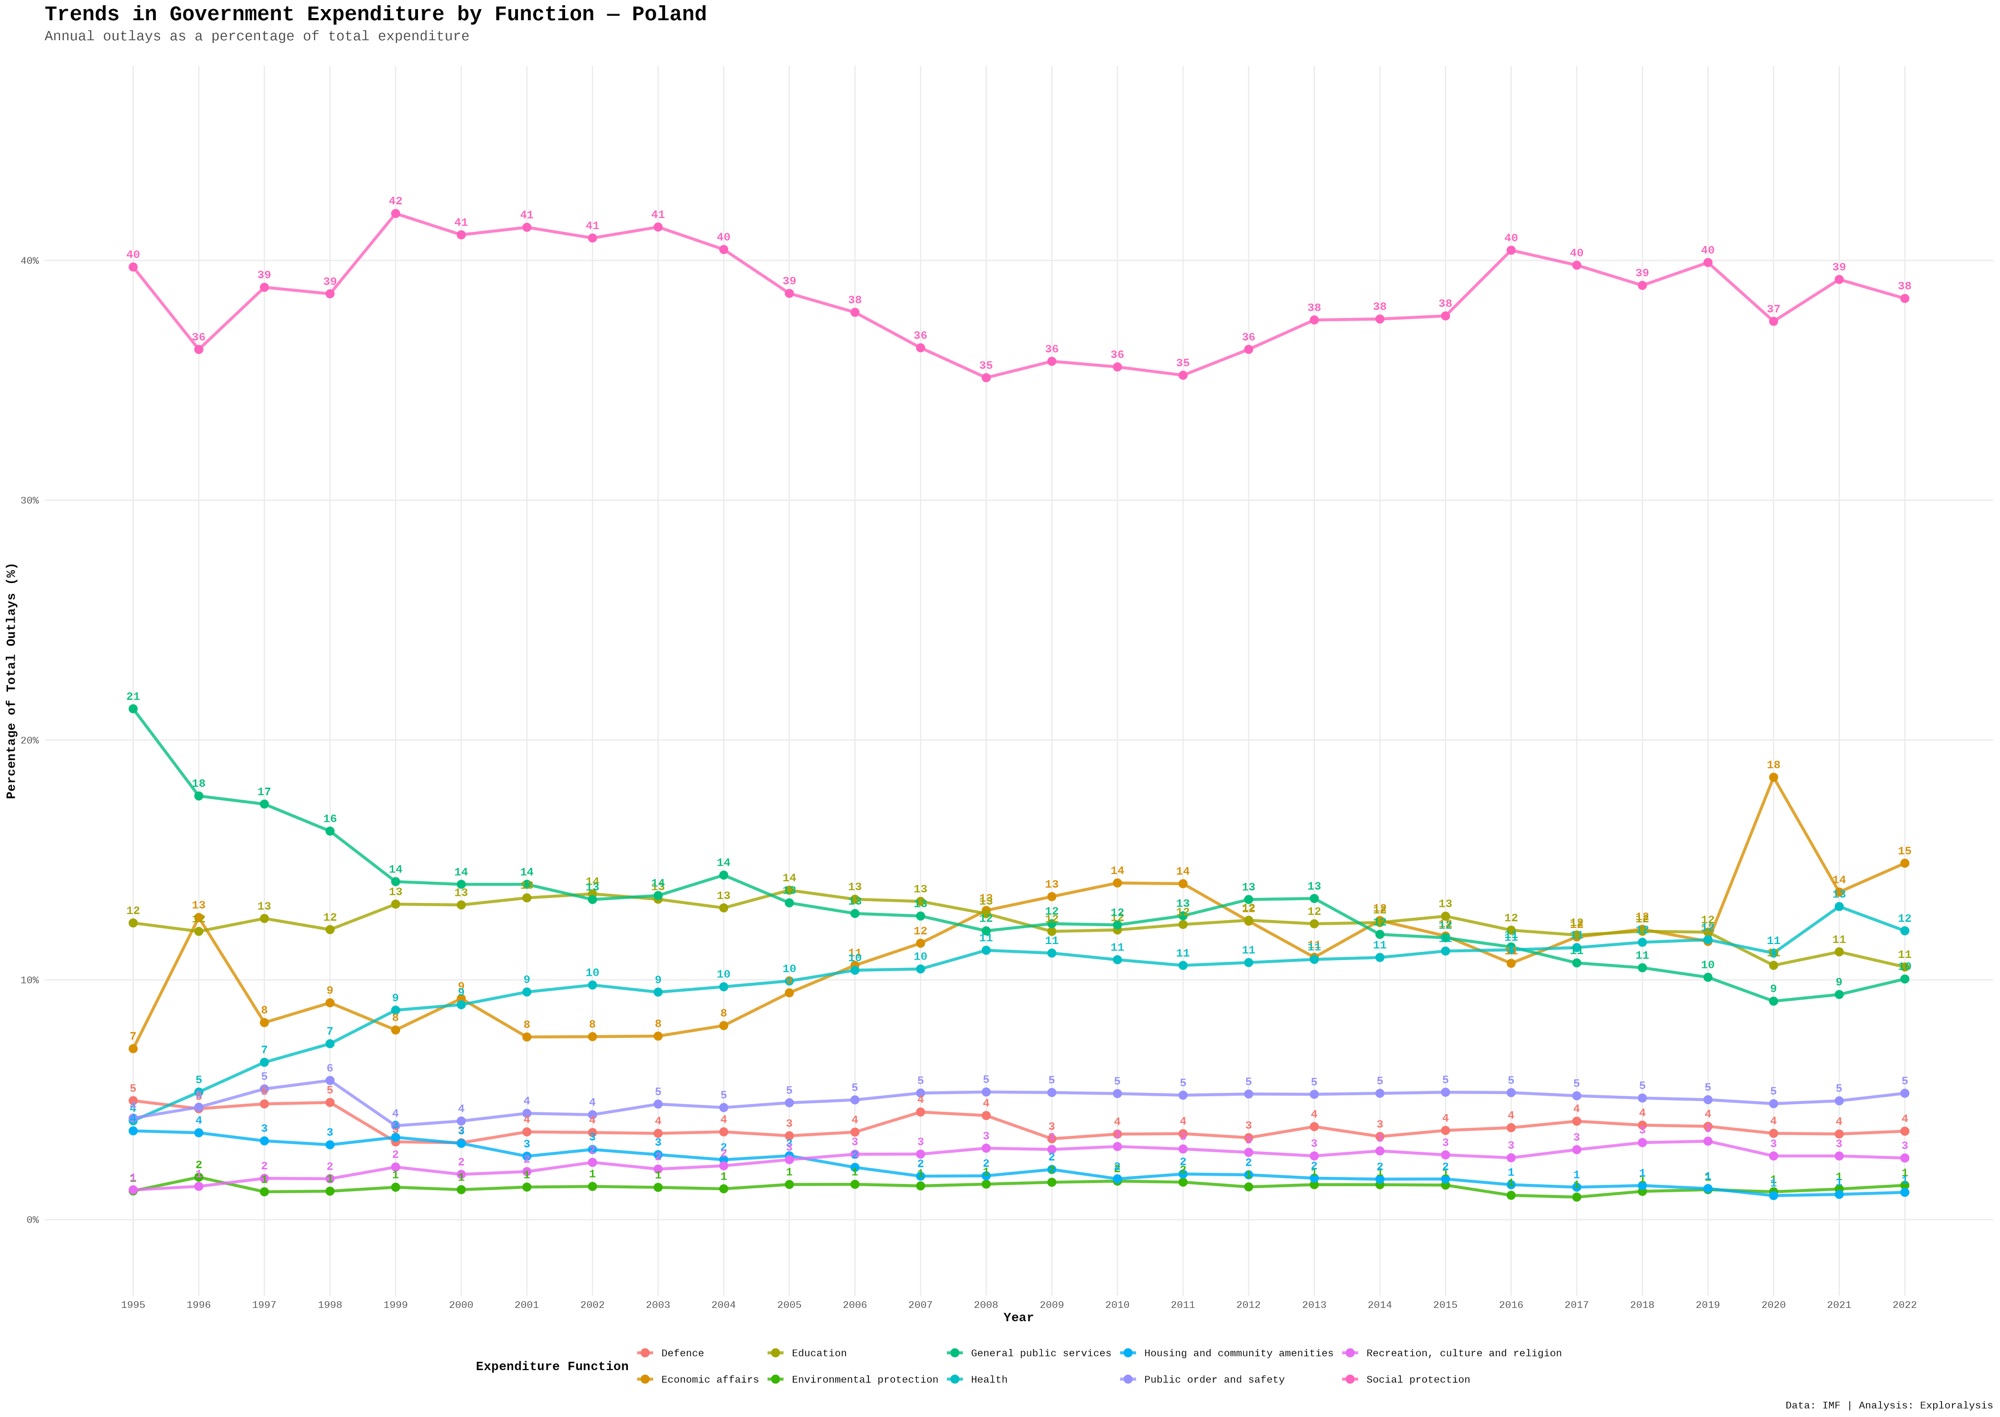
Poland’s spending reflects its transition from a developing to a more advanced economy, with increasing emphasis on welfare and public services.
Overall Patterns Across All Countries
Looking across all 17 countries in both Part 1 and Part 2, several consistent patterns emerge:
- Social protection is the dominant category in most countries
- Health spending shows a gradual upward trend globally
- Economic affairs is more prominent in developing or rapidly growing economies
- Defense varies significantly depending on geopolitical priorities
- Environmental protection and recreation remain relatively small across all countries
These patterns highlight both similarities and differences in how governments prioritize spending.
Final Observations
This second part completes the analysis of government spending across the 17 largest economies in the dataset.
Despite differences in economic structure, political systems, and development levels, most countries share a common emphasis on social protection and healthcare. At the same time, variations in economic affairs and defense reflect national priorities and strategic goals.
Developed economies tend to prioritize welfare and stability, while developing economies allocate more toward growth and infrastructure. However, many countries show a gradual shift toward increased social spending over time.
Conclusion
Together, Part 1 and Part 2 provide a comprehensive view of how major economies allocate government spending.
These insights reveal not only economic priorities but also broader societal values, demographic challenges, and long-term policy directions.
Understanding these patterns is essential for analyzing global economic trends and anticipating future shifts in government policy.
Cover photo by kimmi jun.