
Government spending plays a crucial role in shaping a nation’s economy, social welfare, and overall development. In this series of articles, we dive deep into the International Monetary Fund (IMF) dataset on government expenditures by function, focusing on the 17 largest economies worldwide. This analysis provides a clear picture of how these countries allocate their budgets across various sectors, offering valuable insights for economists, policymakers, and anyone interested in global financial trends.
The data comes from the IMF’s Government Finance Statistics (GFS) on expenditure by function. We selected the general government sector and expressed spending as a percentage of total outlays for simplicity. This approach avoids complexities like GDP comparisons or inflation adjustments, giving a straightforward view of budget composition. The indicators cover 10 major divisions: defense, economic affairs, education, environmental protection, general public services, health, housing and community amenities, public order and safety, social protection, and recreation, culture, and religion.
These categories are based on the United Nations Statistics Division’s Classification of the Functions of Government (COFOG). Here’s a detailed breakdown of each to help you understand what they entail:
1. General Public Services: This includes executive and legislative organs, financial and fiscal affairs, external affairs, foreign aid, basic research, public debt management, and general administrative services not classified elsewhere. It’s essentially the backbone of government operations.
2. Defense: Covers military defense, civil defense, foreign military aid, and related research and development. This category reflects a country’s security priorities.
3. Public Order and Safety: Encompasses police services, fire protection, law courts, prisons, and associated research and development. It focuses on maintaining internal security and justice.
4. Economic Affairs: Involves support for agriculture, forestry, fishing, energy, mining, manufacturing, transport, communication, tourism, and general economic or commercial policies. This is key for economic growth and infrastructure.
5. Environmental Protection: Focuses on waste management, pollution abatement, protection of biodiversity and landscapes, and environmental research and development. It’s increasingly important in today’s climate-conscious world.
6. Housing and Community Amenities: Includes housing development, community development, water supply, street lighting, and related research and development. This supports urban and rural living standards.
7. Health: Covers medical products, hospital services, public health services, ambulances, and health-related research and development. A critical area, especially post-pandemic.
8. Recreation, Culture, and Religion: Encompasses recreational and sporting services, cultural services like museums and libraries, broadcasting, publishing, and religious or community services. It enhances quality of life.
9. Education: Includes pre-primary, primary, secondary, post-secondary, tertiary education, subsidiary services like transportation and meals, and education research and development. Investing here builds future human capital.
10. Social Protection: Covers sickness and disability benefits, old-age pensions, family and child support, unemployment aid, housing assistance for the needy, and social exclusion programs. This is often the largest slice, reflecting welfare commitments.
The data spans from as early as 1972 to 2024, though availability varies by country. We aimed to cover the top 20 economies by GDP, but data for India, Mexico, and Saudi Arabia was unavailable, leaving us with 17: the United States, China, Germany, Japan, the United Kingdom, France, Italy, Russia, Canada, Brazil, Spain, Australia, South Korea, Turkey, Indonesia, the Netherlands, and Poland (ordered by GDP).
For each country, we’ve visualized the data with bar charts for proportional views and line charts for trends over time. Numbers are rounded, and we exclude “total outlays (adjustment)” which might cause sums to slightly deviate from 100%. This article focuses on individual country analyses, with brief cross-comparisons. A dedicated comparison article may follow.
Before diving in, some general patterns across all countries and years: Social protection is almost always the dominant category, typically around 30%. Other key areas include economic affairs, education, health, and general public services, which vary more. Environmental protection and recreation, culture, and religion stay below 5%, while housing and community amenities and public order and safety are under 12%. Defense is below 11% except in the U.S.
United States Government Spending Analysis
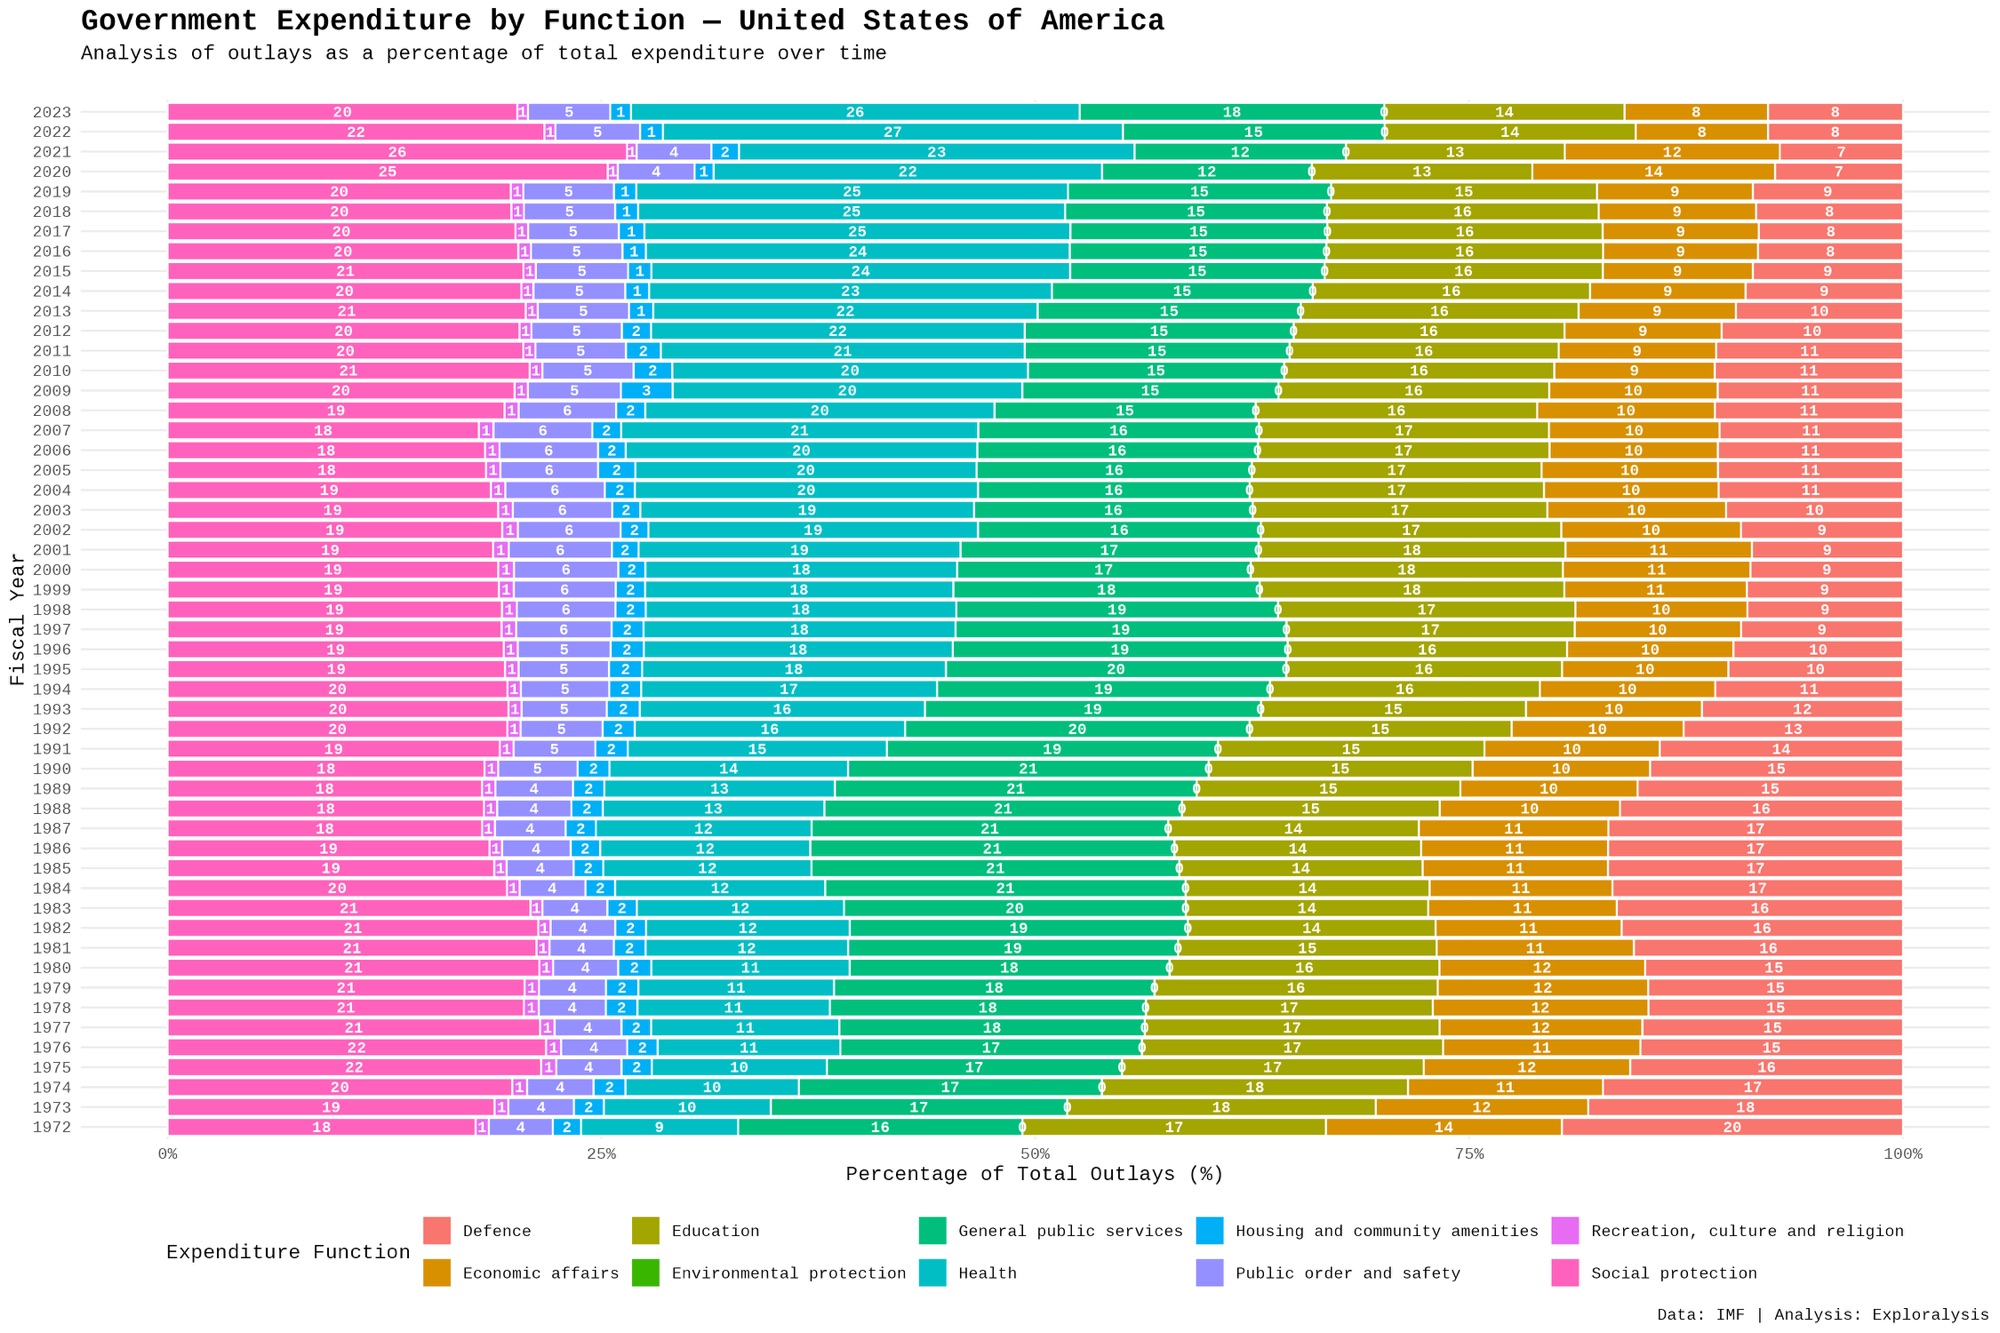
The U.S. data covers 1972 to 2023. In the bar chart, social protection and health dominate, followed by general public services and education. Social protection remains consistent, with spikes in 2020 and 2021 likely due to COVID-19 relief efforts.
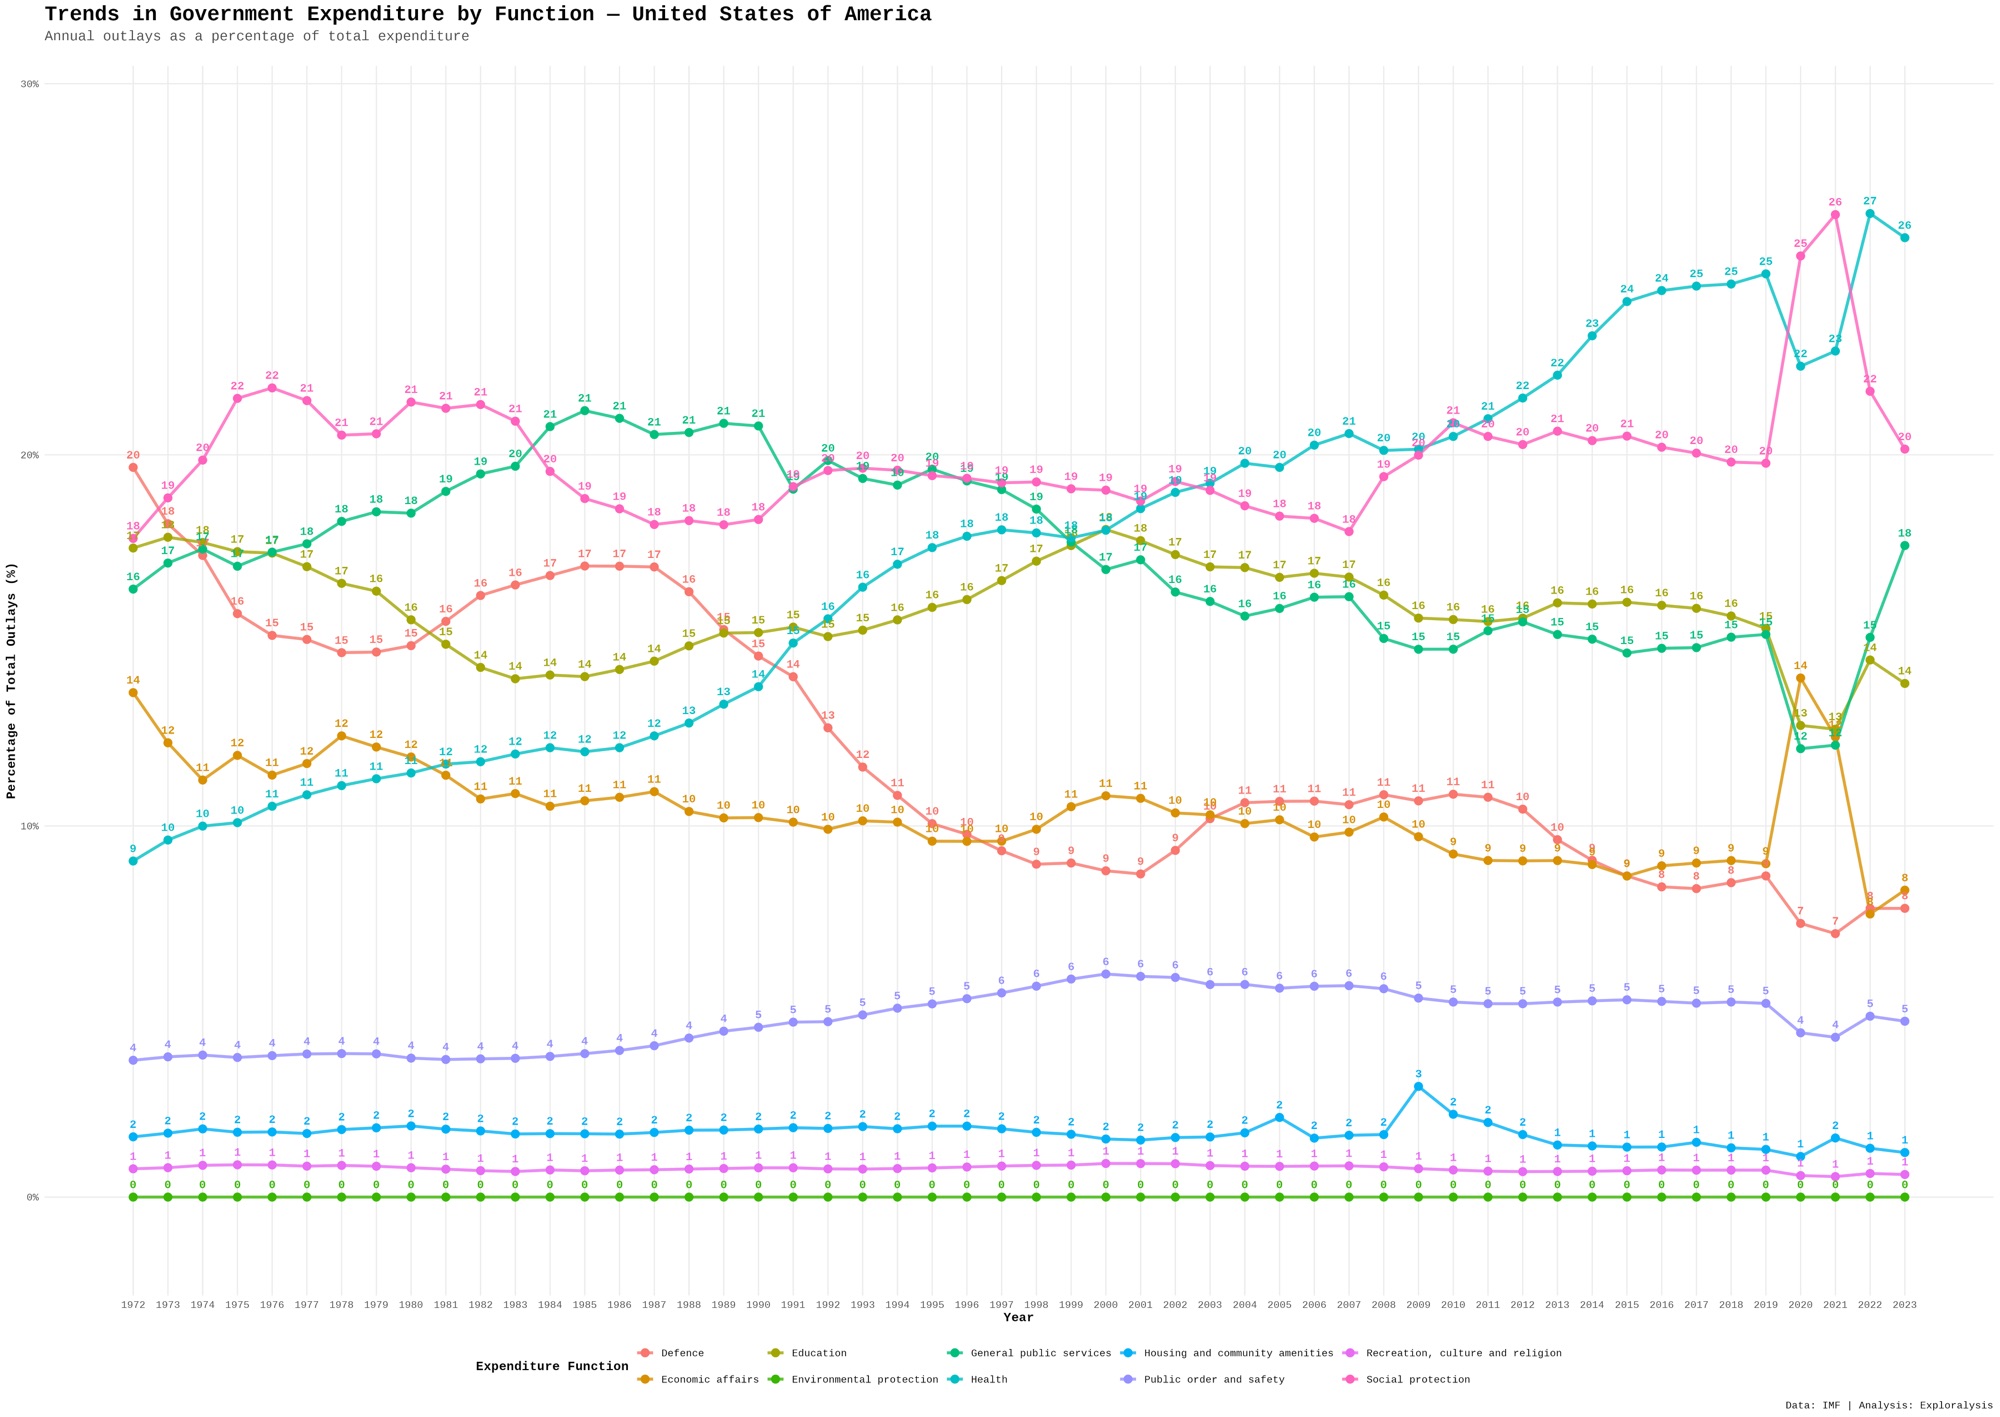
The line chart reveals health gradually increasing since 1972, dipping during the pandemic. Spikes in social protection, economic affairs, and housing and community amenities occur in 2020-2021, while defense, public order and safety, education, health, and general public services dip. Defense drops sharply from 1987 to 1996, peaks mildly from 2005 to 2011, then declines. Other categories like economic affairs, environmental protection, recreation, culture, and religion, housing and community amenities, and public order and safety are relatively flat outside pandemic years. General public services trend downward, education shows mid-term fluctuations but long-term stability.
Overall, U.S. spending is balanced across major categories, with steady focus on social protection and growing health emphasis. Defense’s decline suggests shifting priorities from military to domestic needs. This composition reflects a mature economy balancing welfare, health, and security.
China Government Spending Analysis
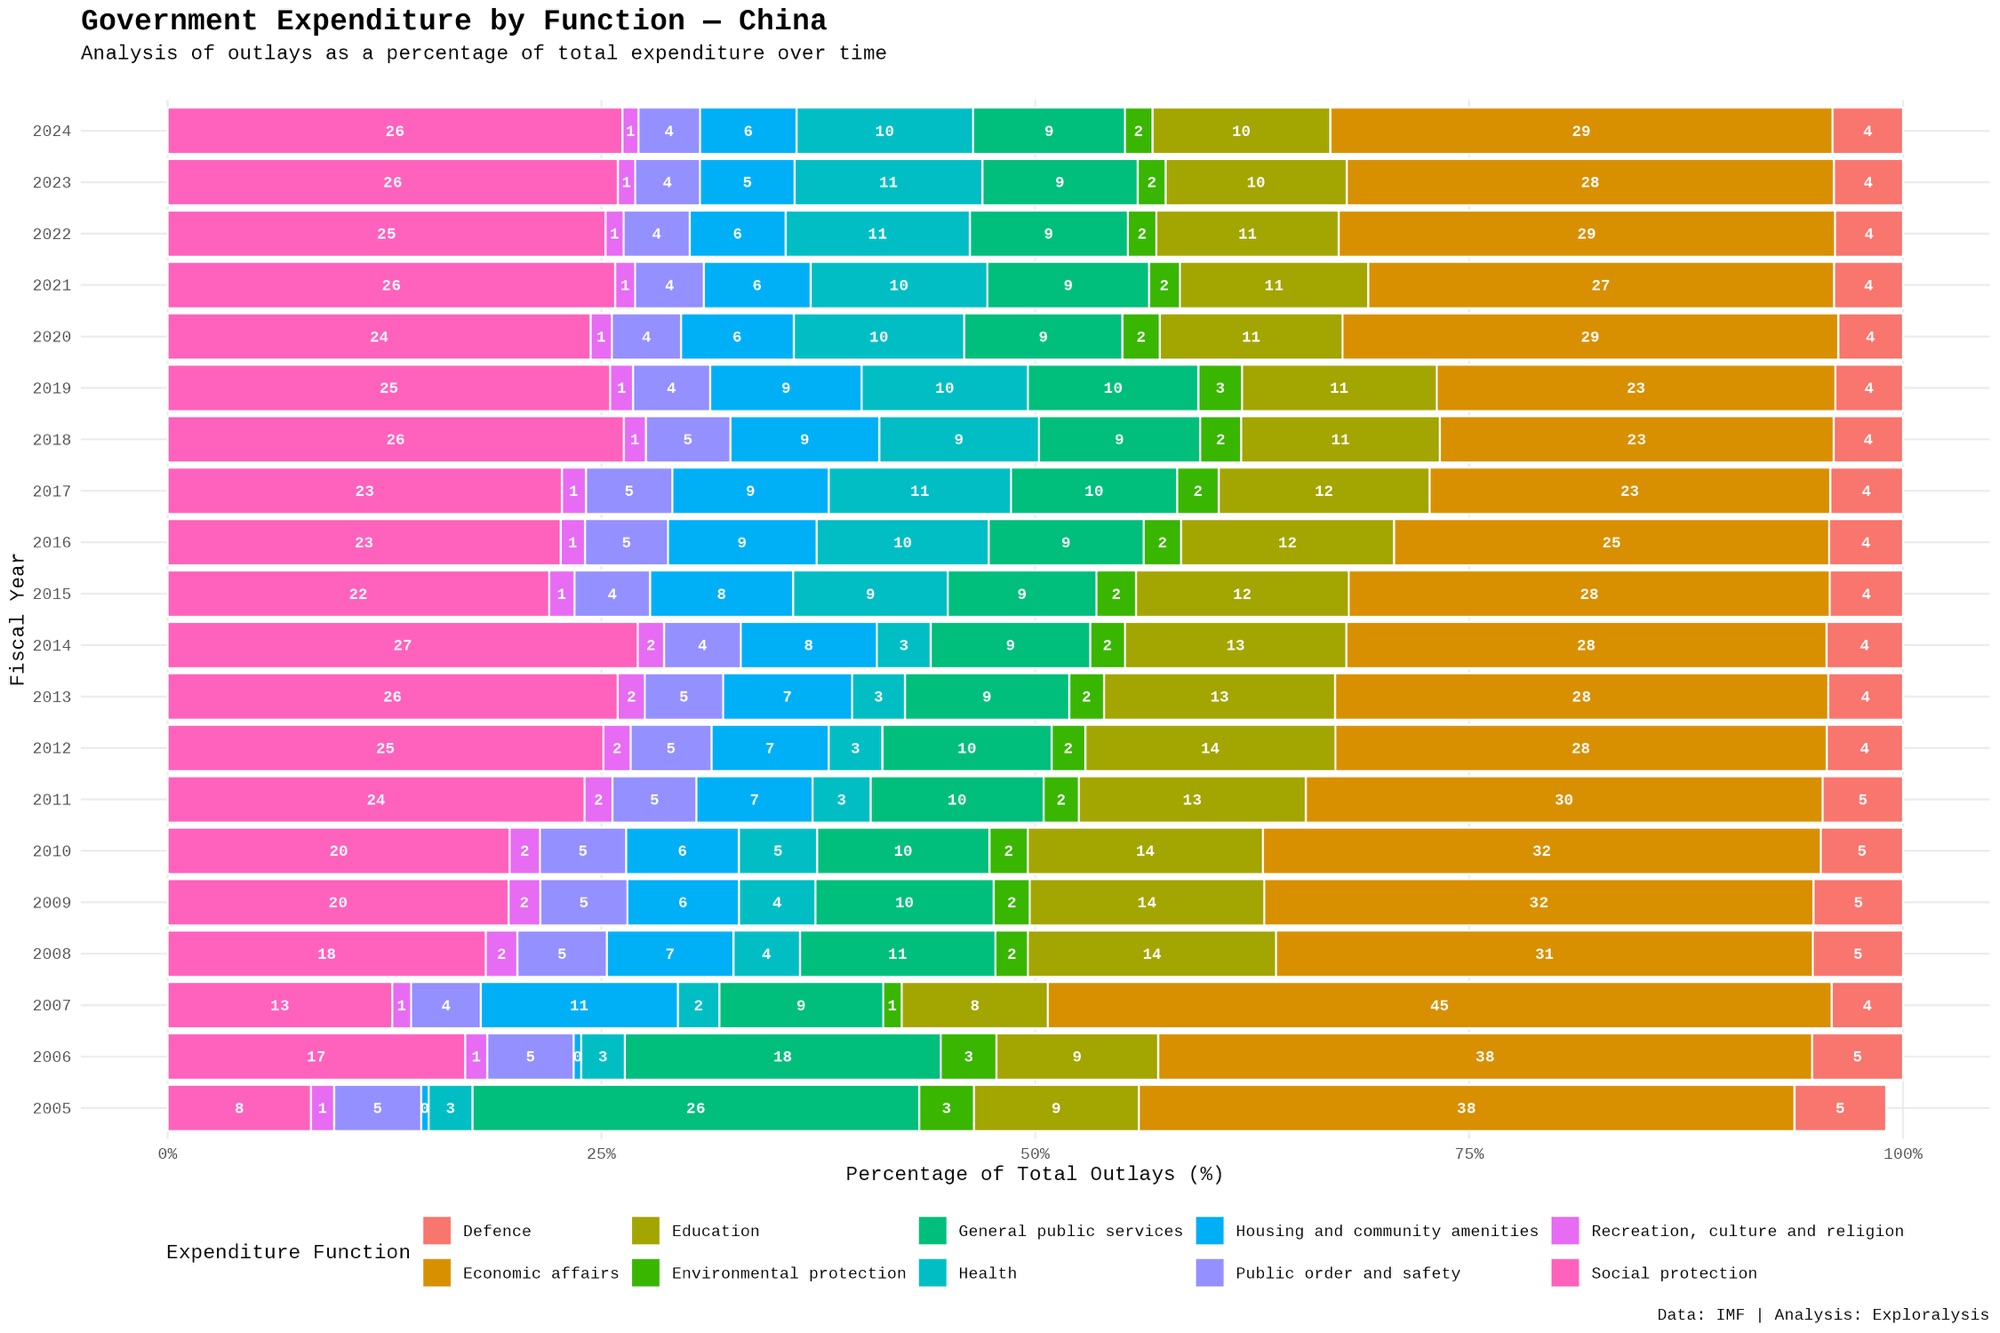
China’s data spans 2005 to 2024. Economic affairs and social protection lead, followed by general public services and education. In 2005, general public services pushed social protection down to 8%, but it rebounded above 12% thereafter. Economic affairs stays above 22%, indicating strong infrastructure and growth focus.
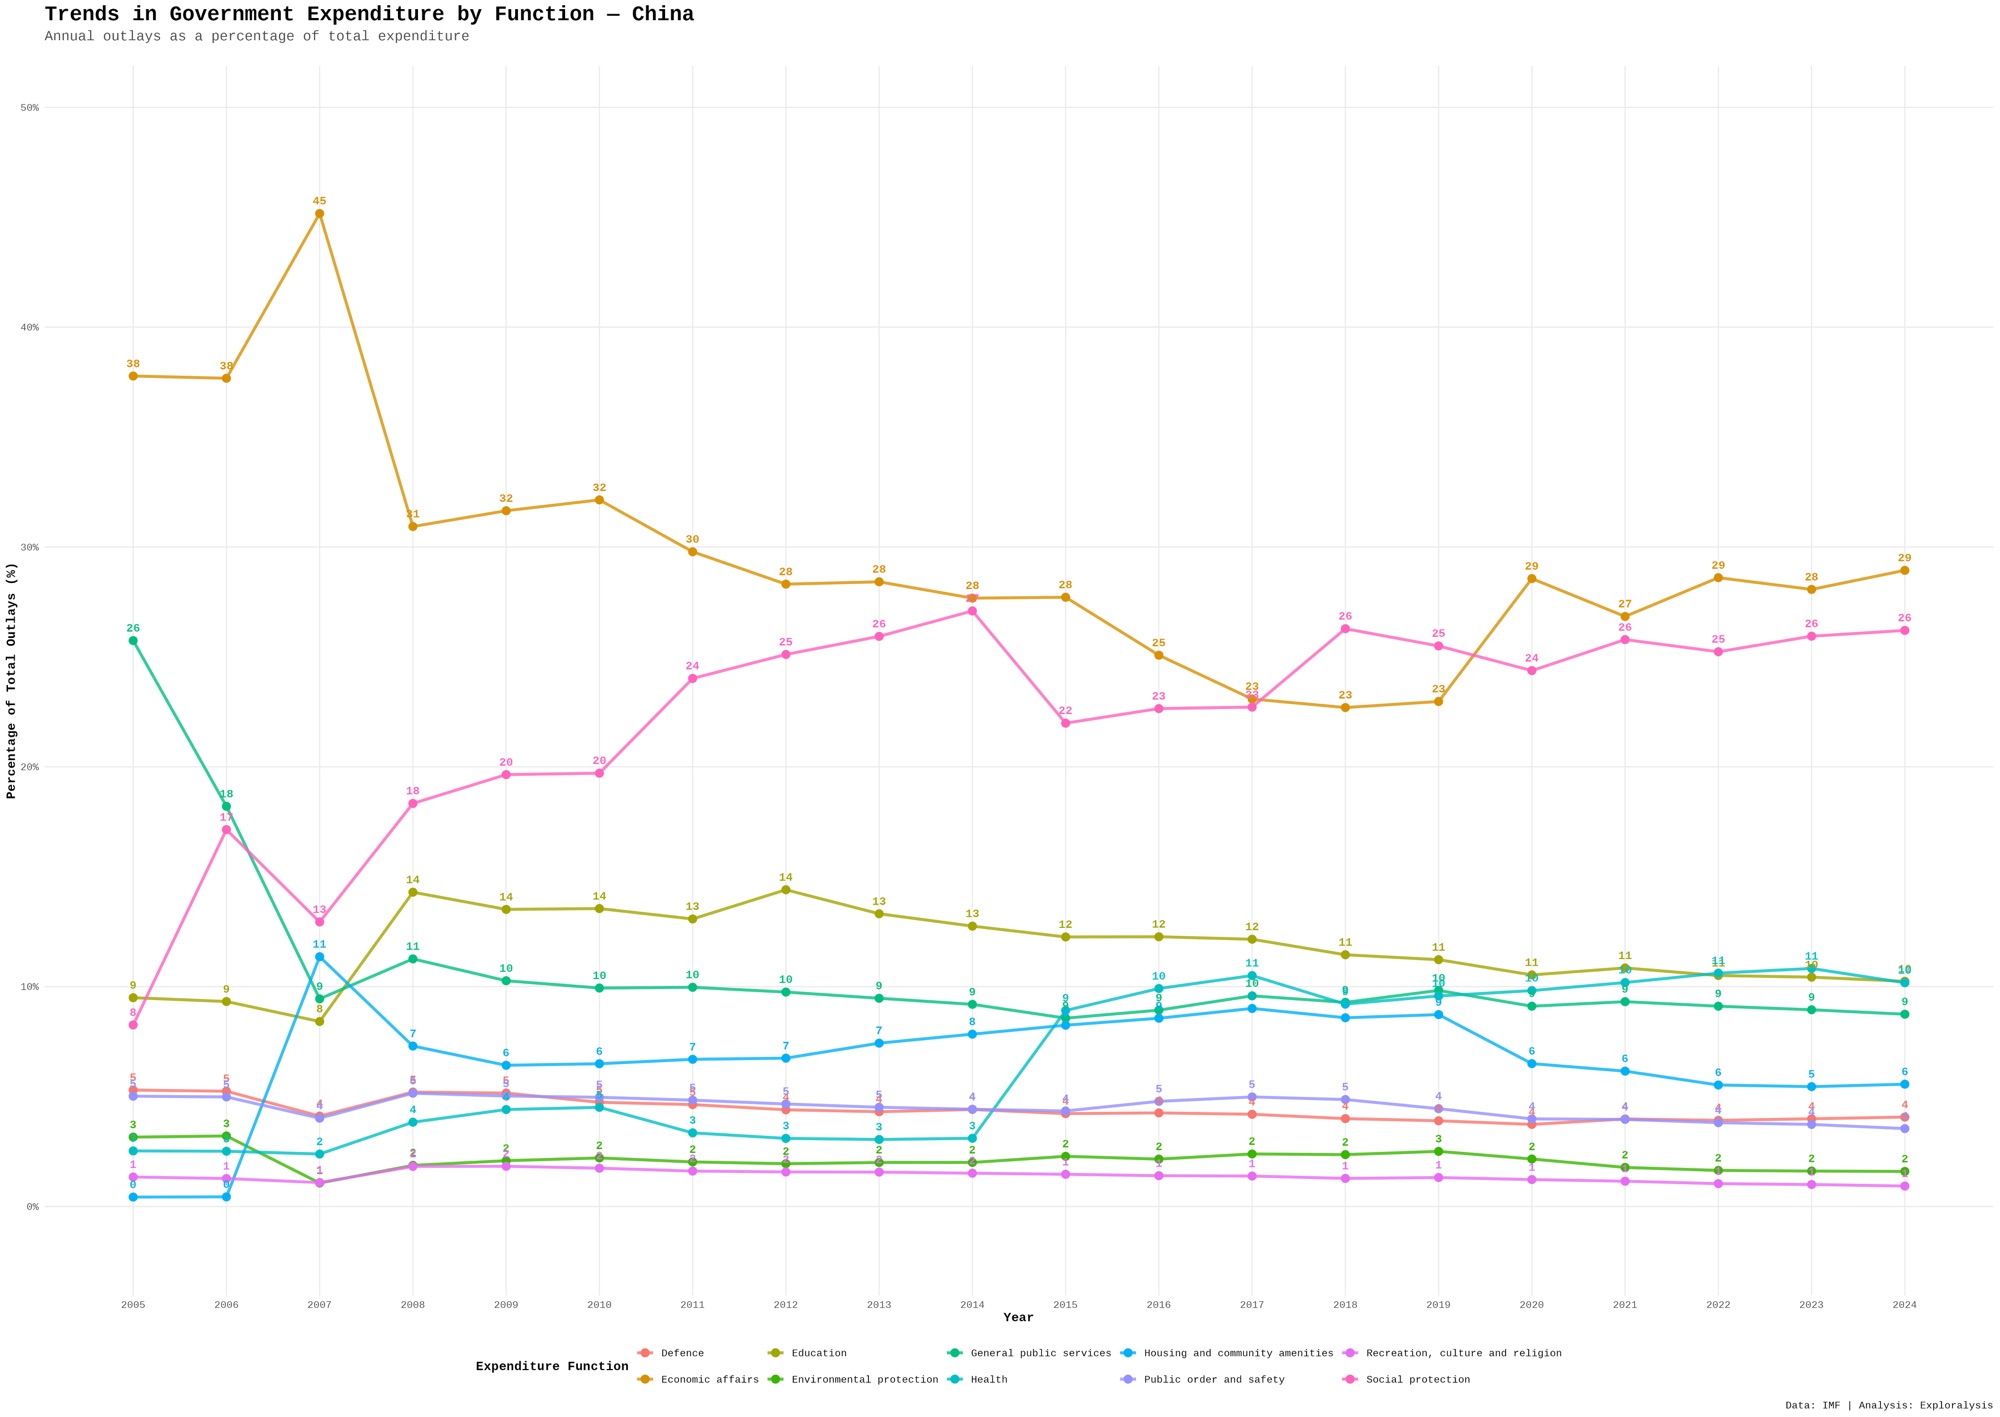
The line chart shows a 2007 spike in economic affairs, with a slow decline overall while social protection rises. Step-like shifts occur: health rises in 2014, housing and community amenities in 2007, education in 2008—all at economic affairs’ expense. General public services drops in 2007 to a lower plateau.
China emphasizes economic affairs for rapid development, with increasing social protection as the population ages. Defense remains low, aligning with domestic priorities. This pattern highlights China’s transition from pure growth to balanced welfare.
Germany Government Spending Analysis
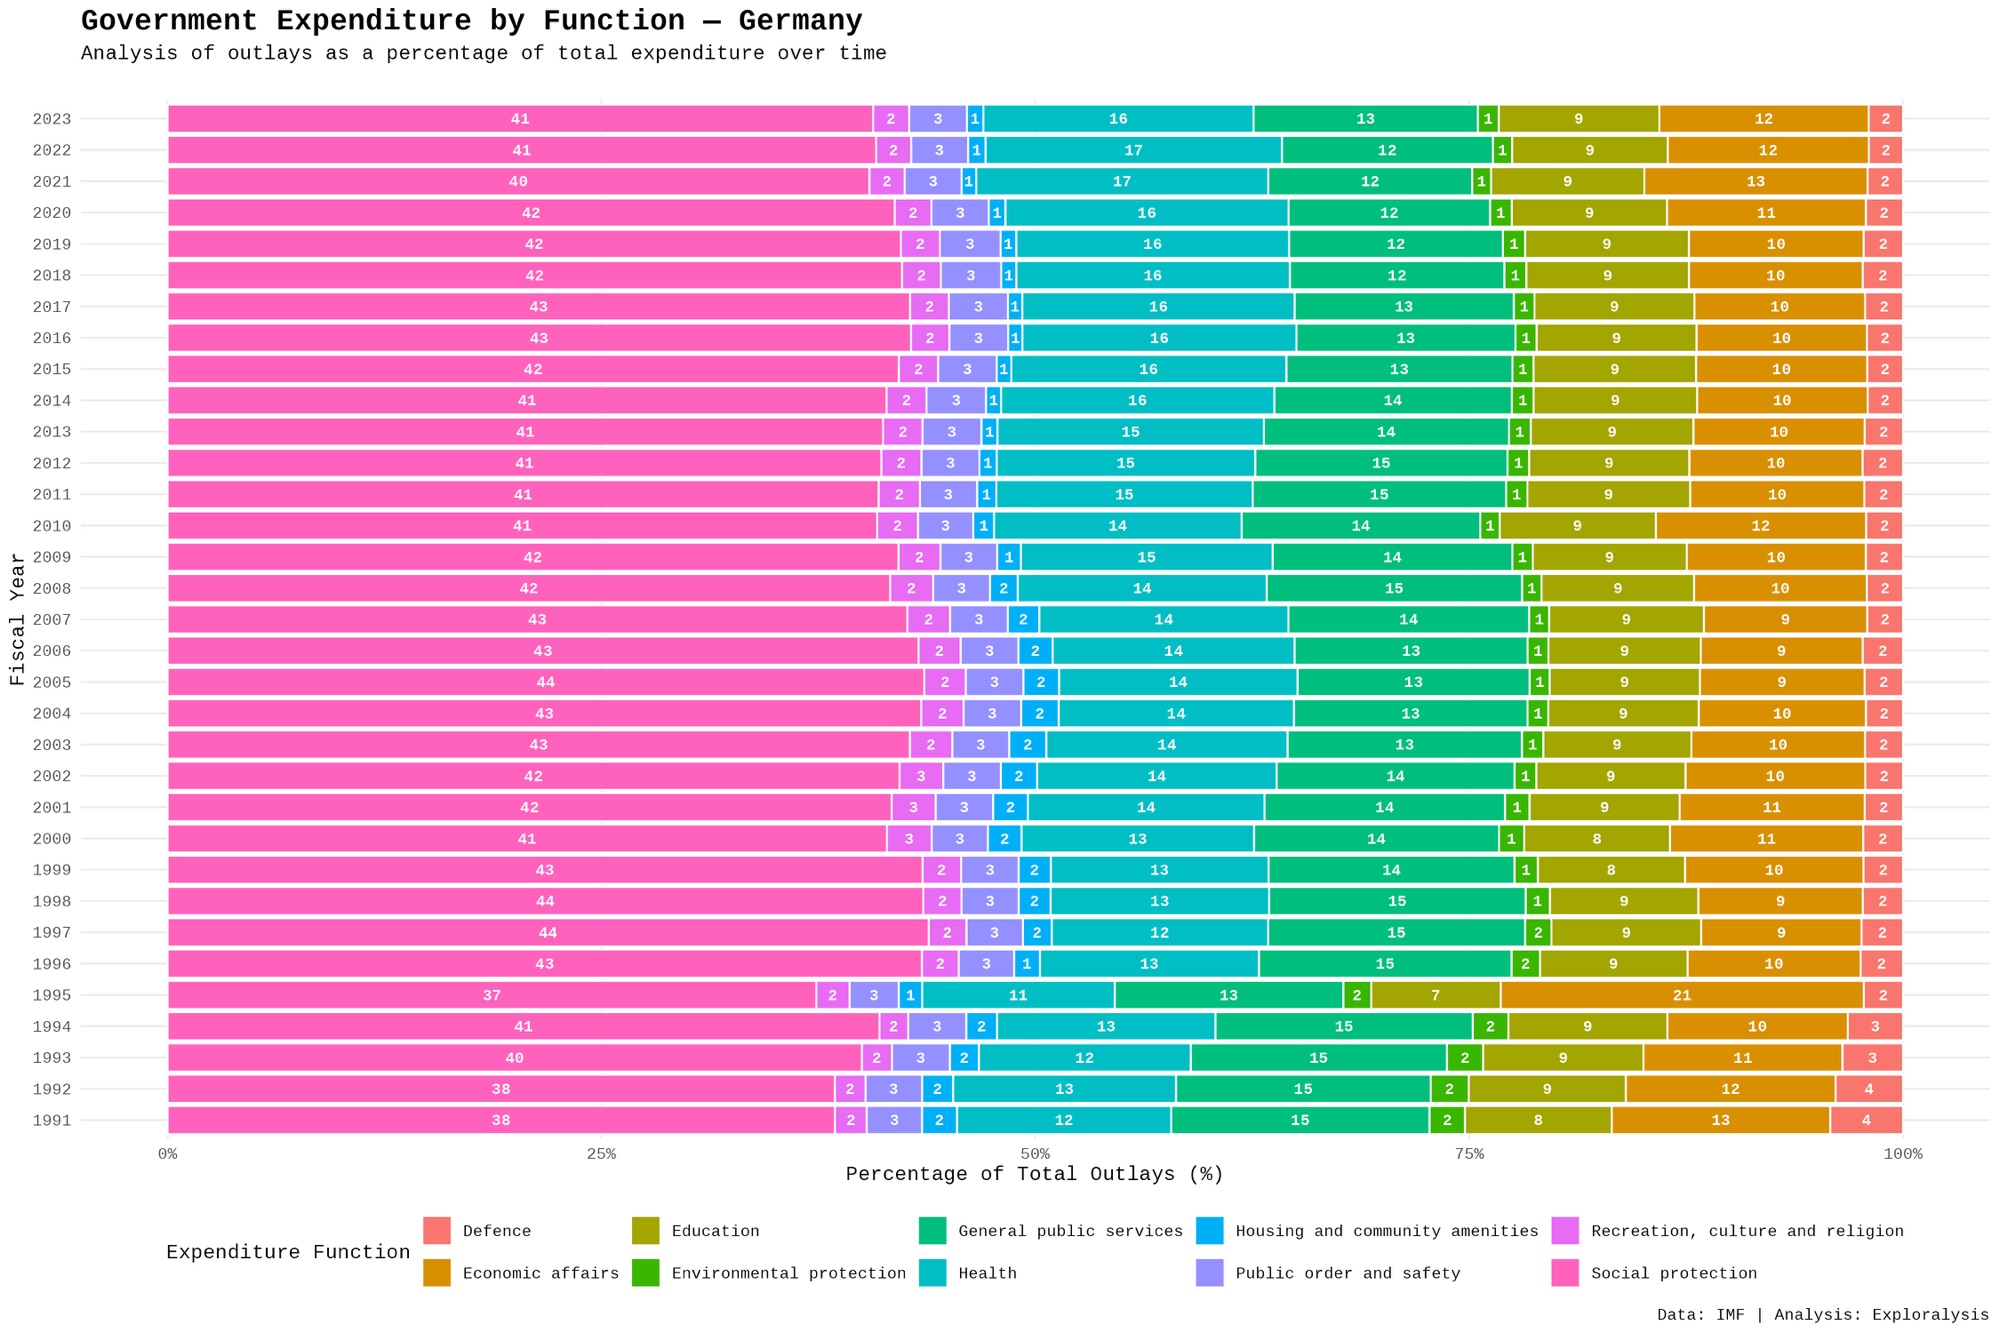
Germany’s dataset runs from 1991 to 2023. Social protection exceeds 36%, dominating consistently. Health and general public services follow equally, then economic affairs and education. A 1995 anomaly sees economic affairs at 21% (usually ~10%), compressing education, health and social protection.
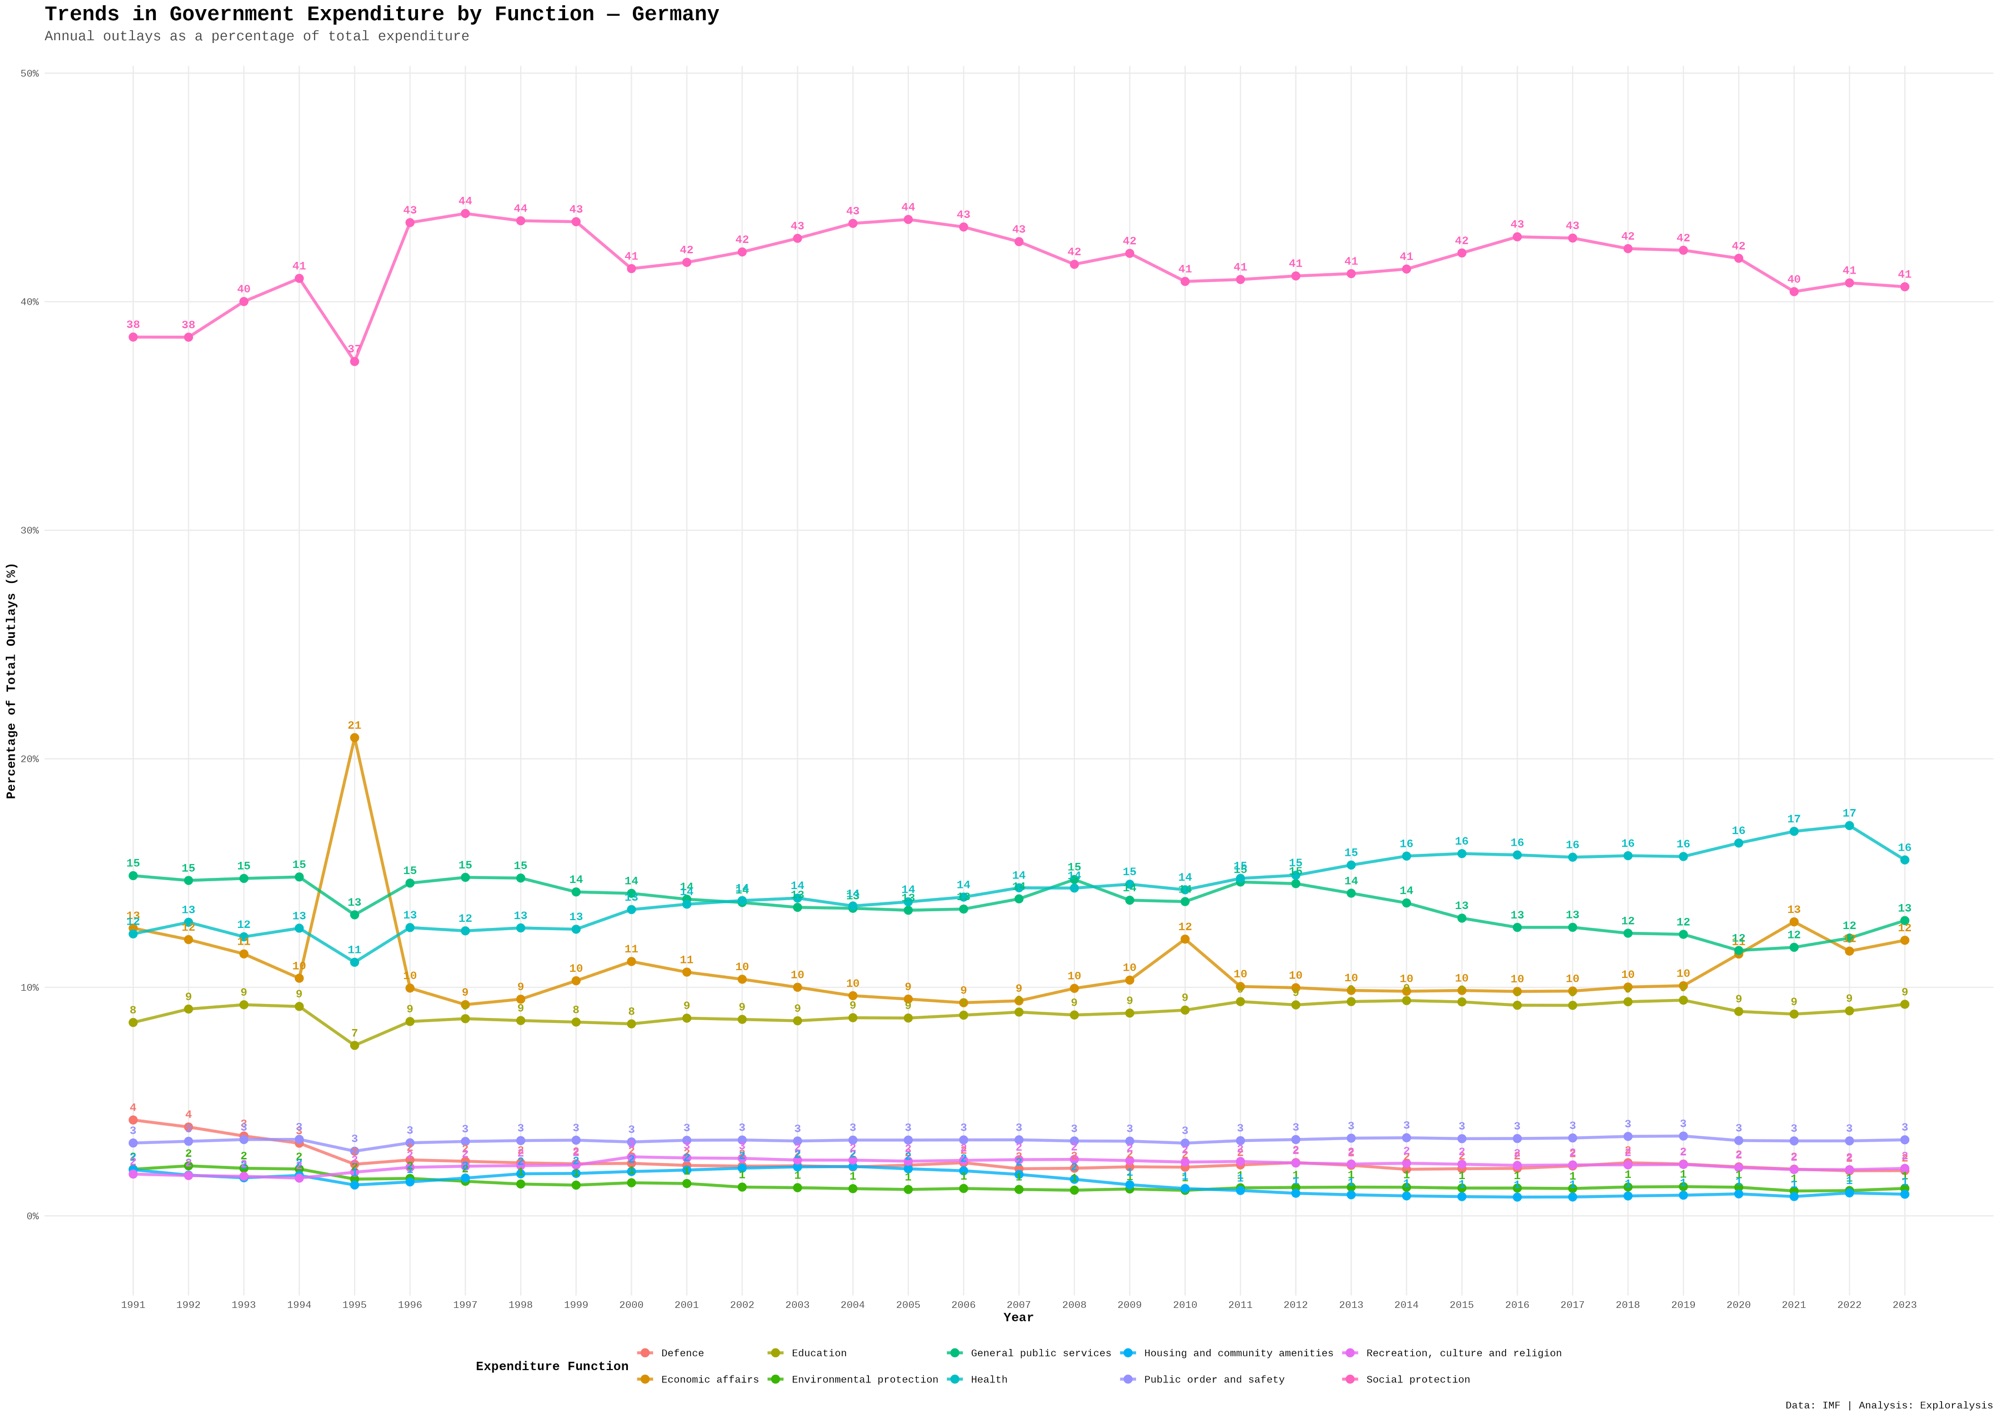
Line charts show mostly flat trends. General public services, economic affairs, and social protection have some movement; health increases slowly since 2012. Others remain stable.
Germany’s stable composition reflects its strong social market economy, with high welfare spending. The 1995 spike might relate to dissolution of the Treuhandanstalt. This makes Germany a model for balanced, predictable budgeting.
Japan Government Spending Analysis
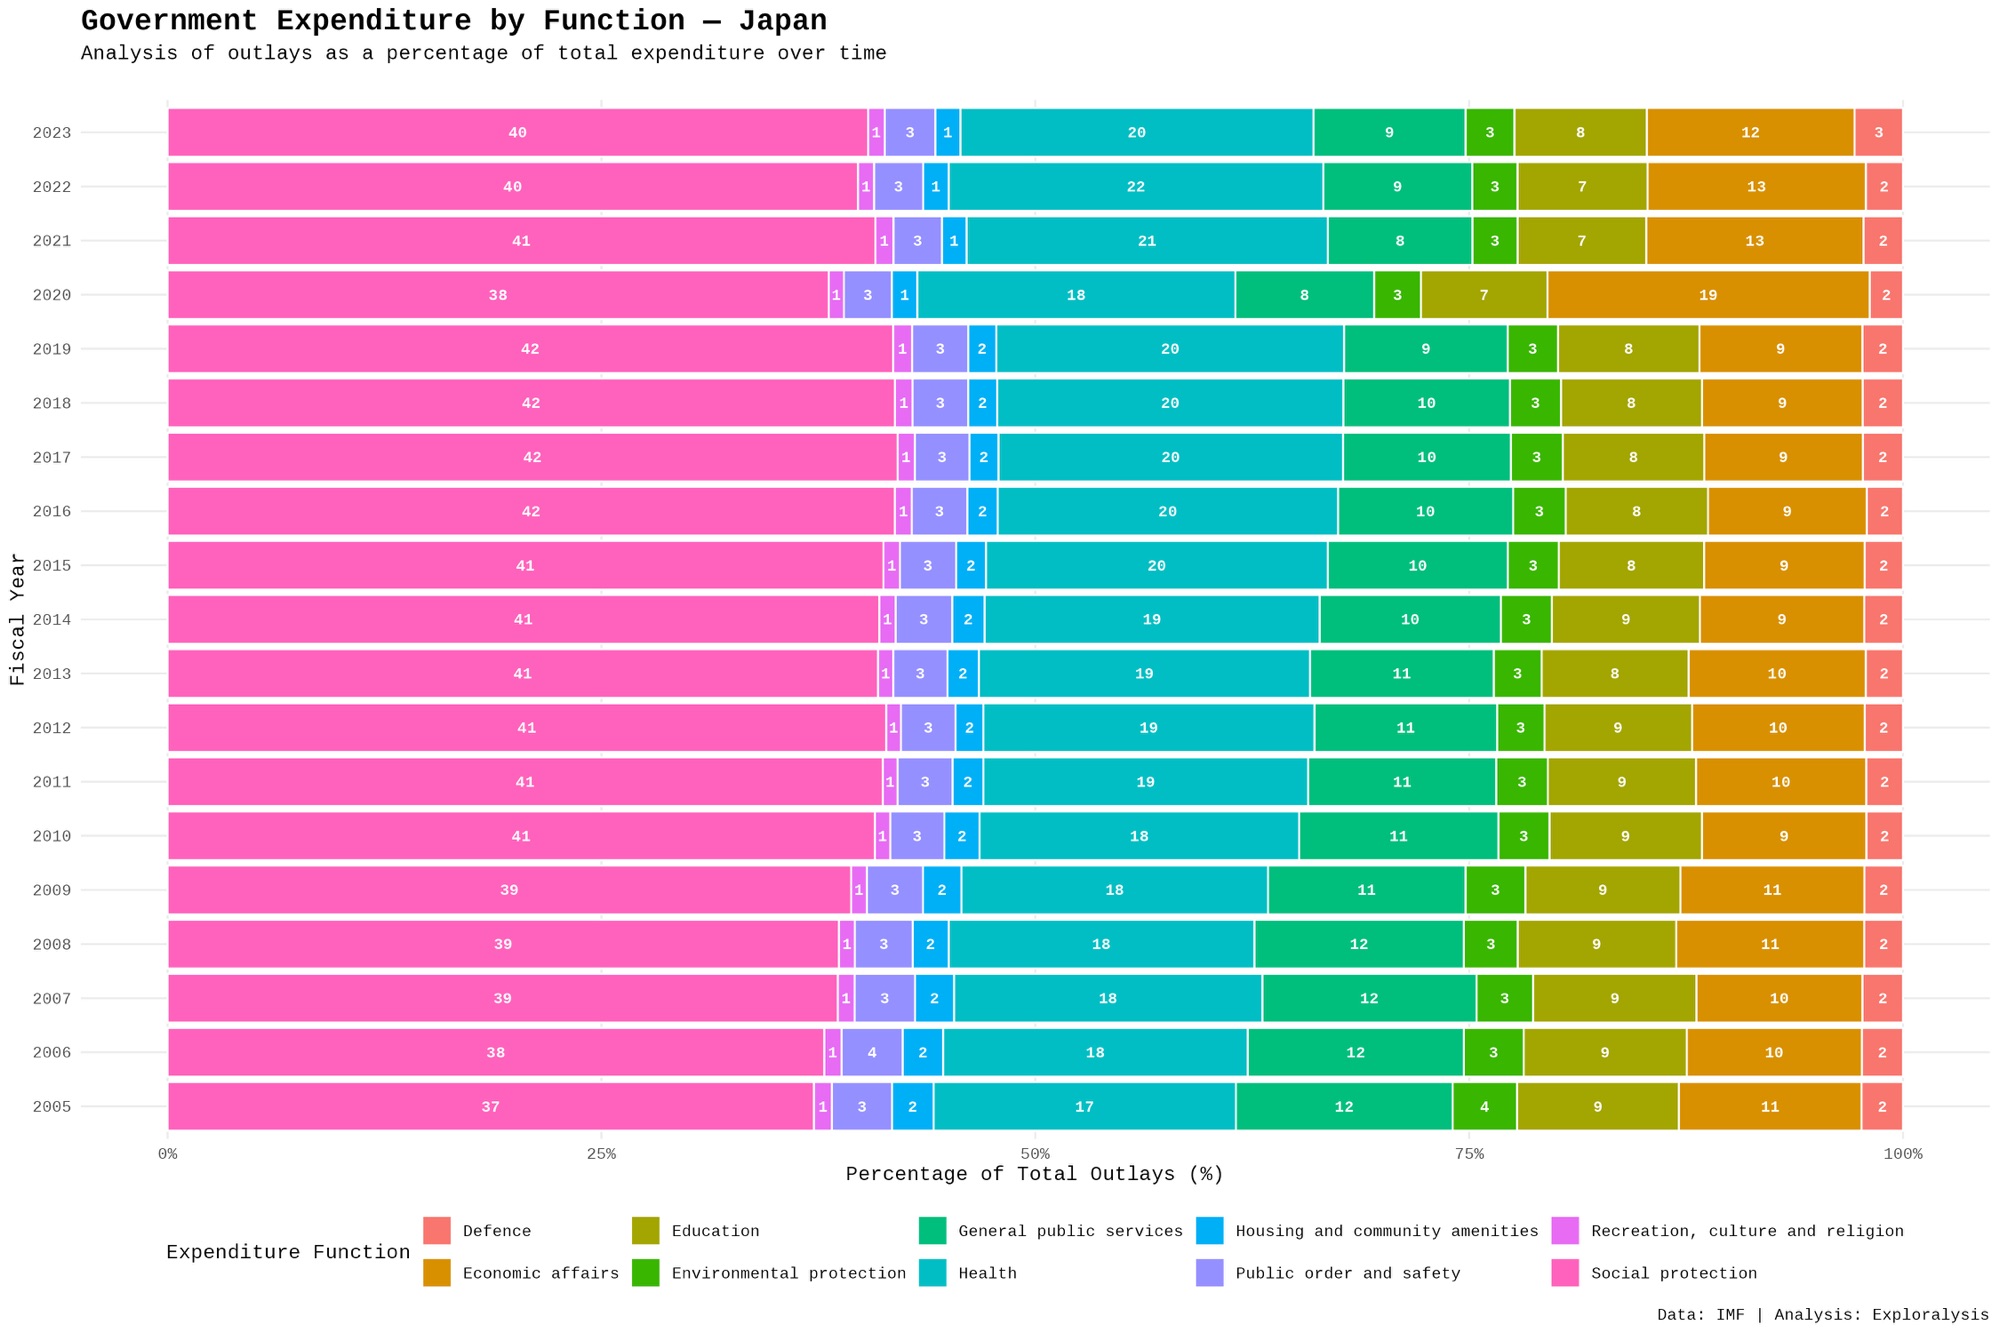
Japan’s data is from 2005 to 2023. Social protection leads at over 36%, followed by health, economic affairs, general public services, and education. Defense hovers at 2%, rising to 3% in 2023. In 2020, economic affairs surged during the pandemic, reducing social protection.
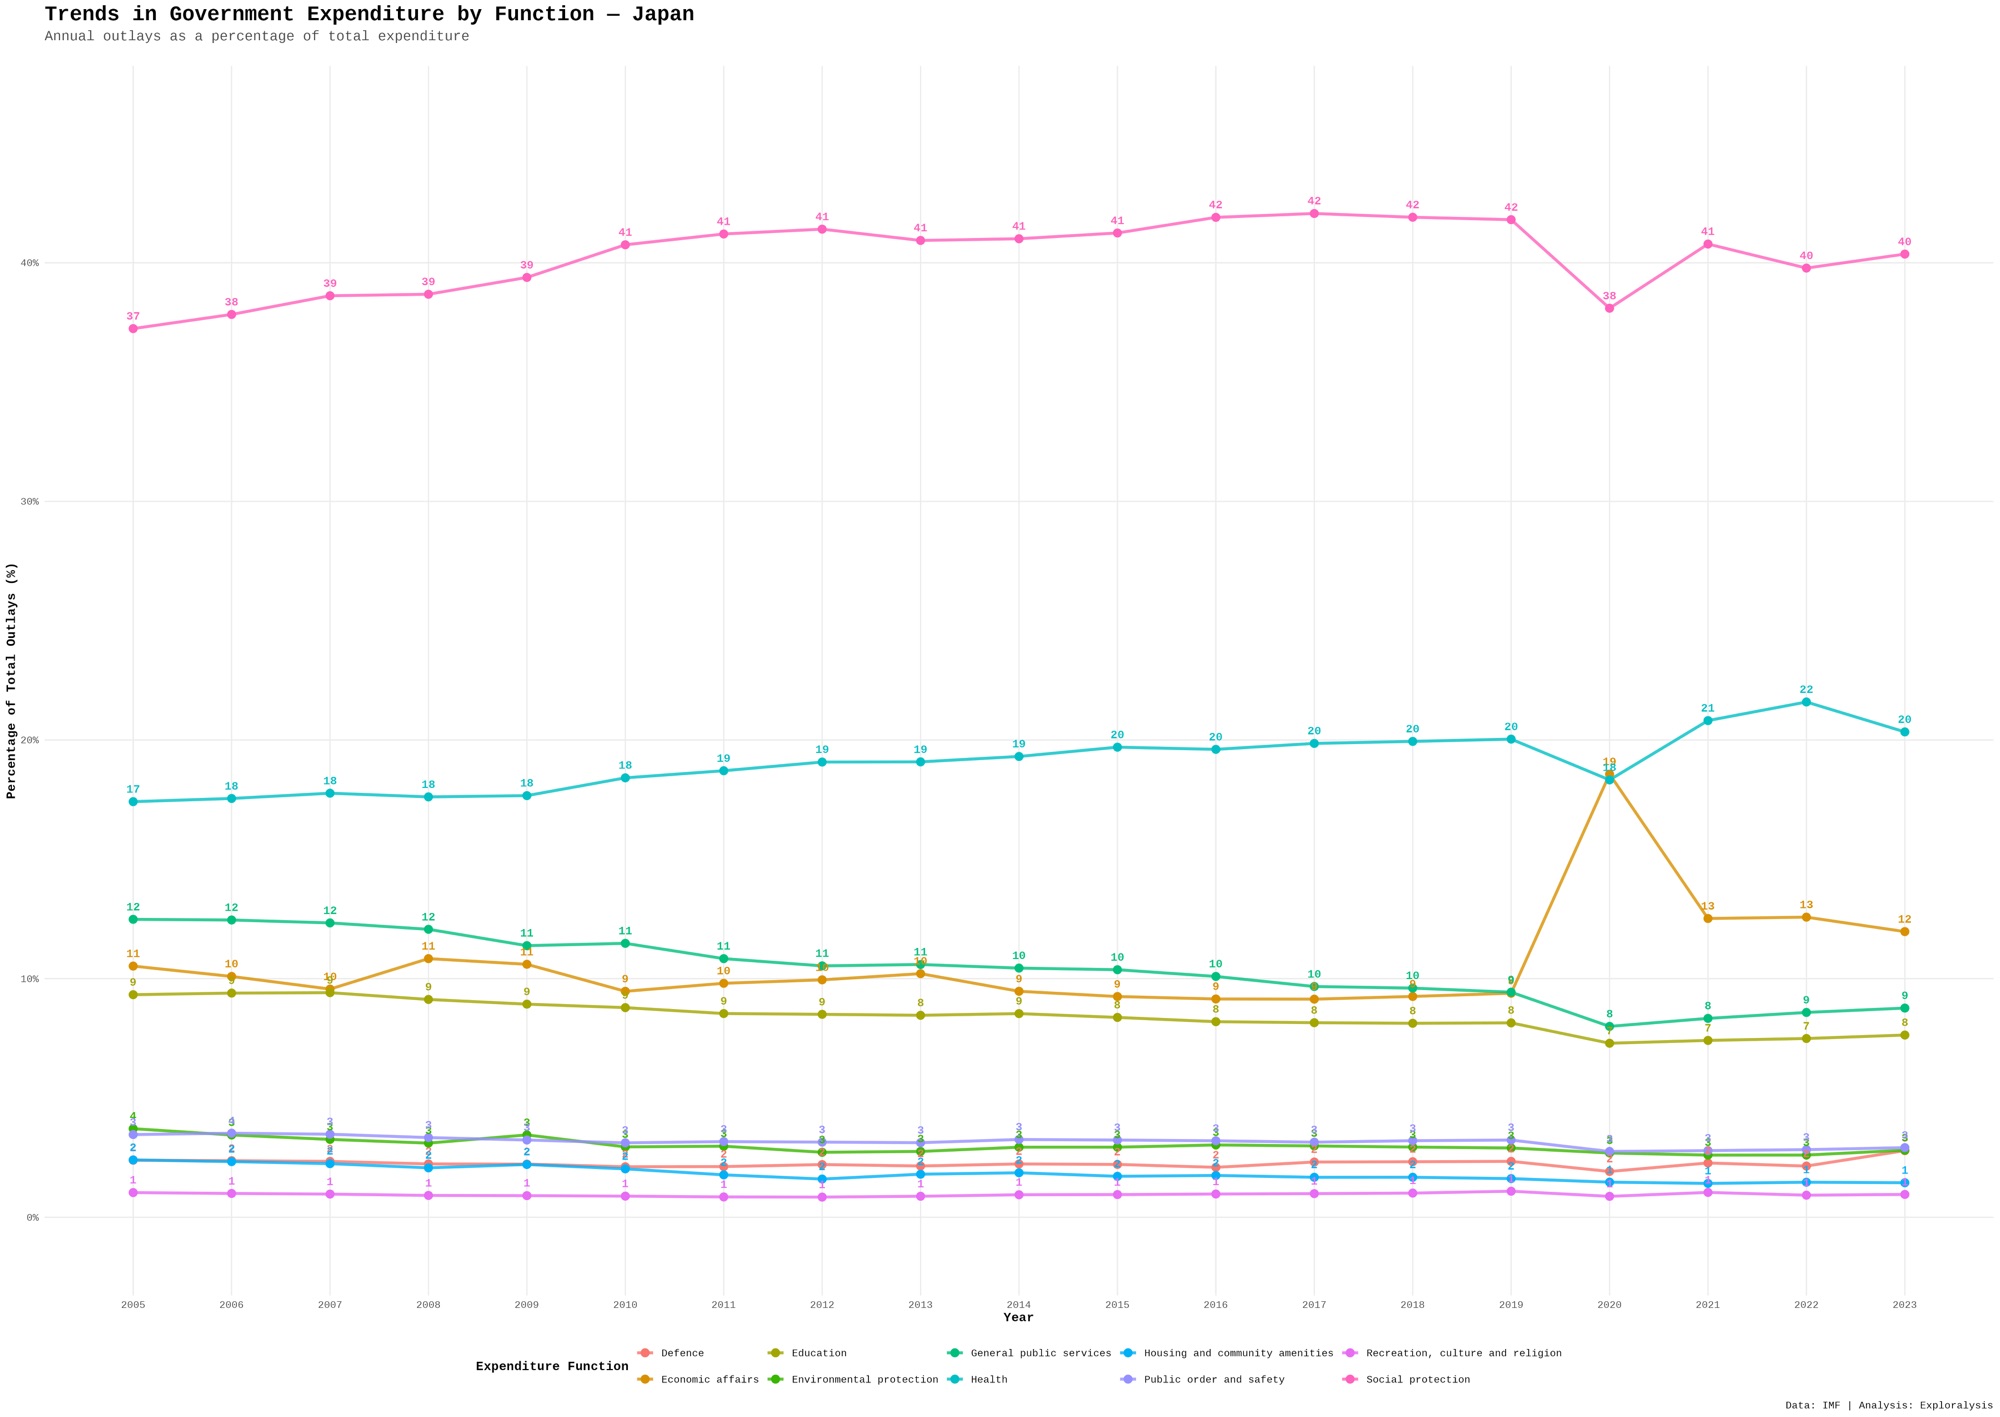
Line charts show economic affairs settling higher post-2020, suggesting policy shifts. Health and social protection increase slowly; general public services decrease.
Japan’s aging population drives high social protection and health spending. Post-pandemic adjustments indicate adaptive economic strategies, maintaining overall stability.
United Kingdom Government Spending Analysis
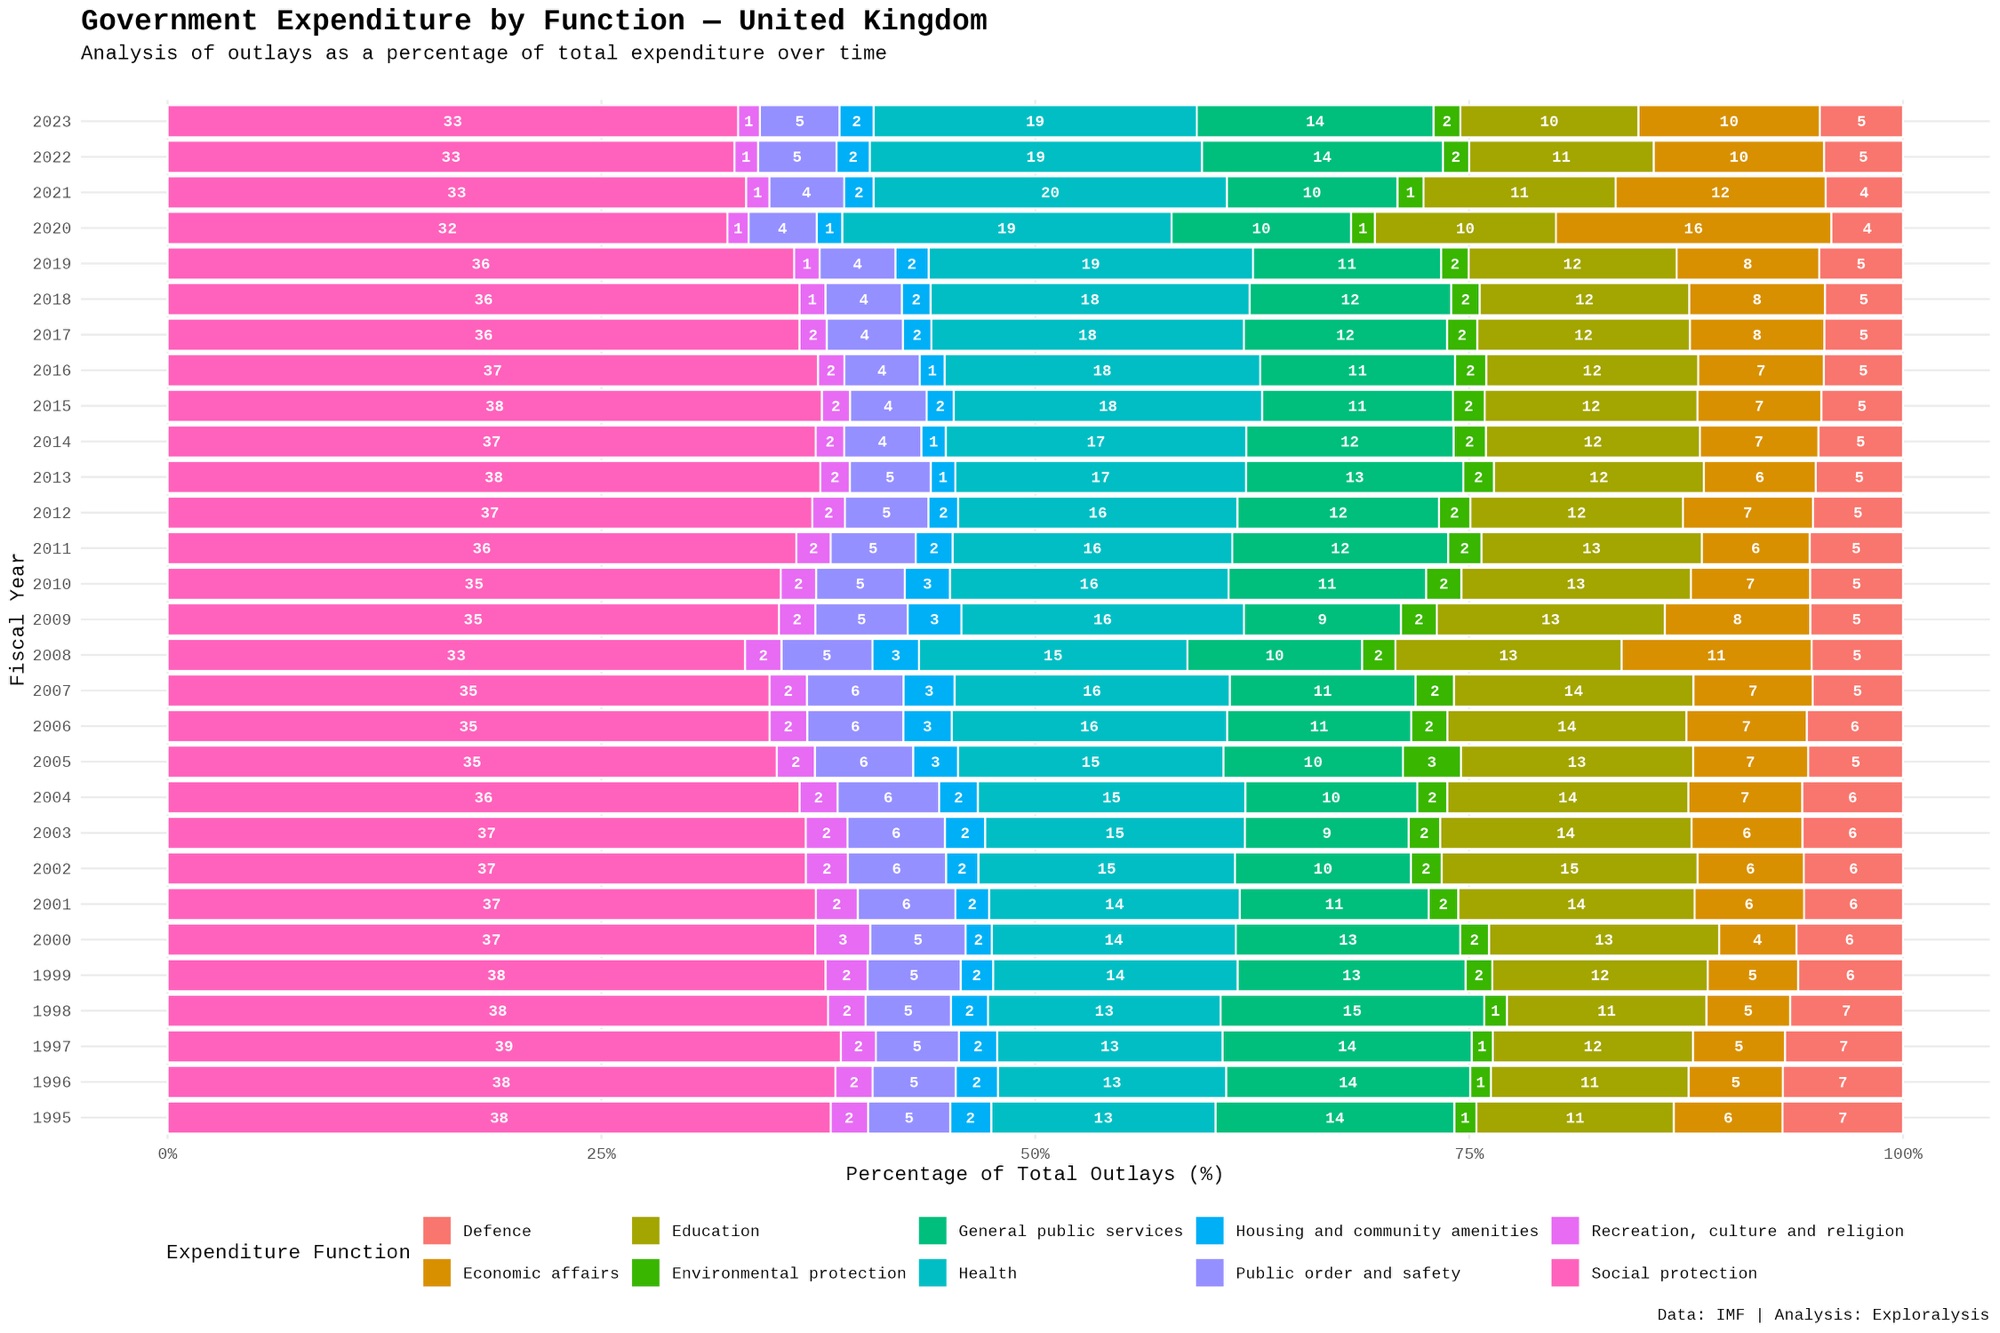
The UK’s data covers 1995 to 2023. Social protection tops 31%, followed by health, education, general public services, and economic affairs. Anomalies: 2008 economic affairs rise (financial crisis response), and 2020 surge (pandemic, doubling prior levels). Post-2020, economic affairs stay higher, social protection lower.
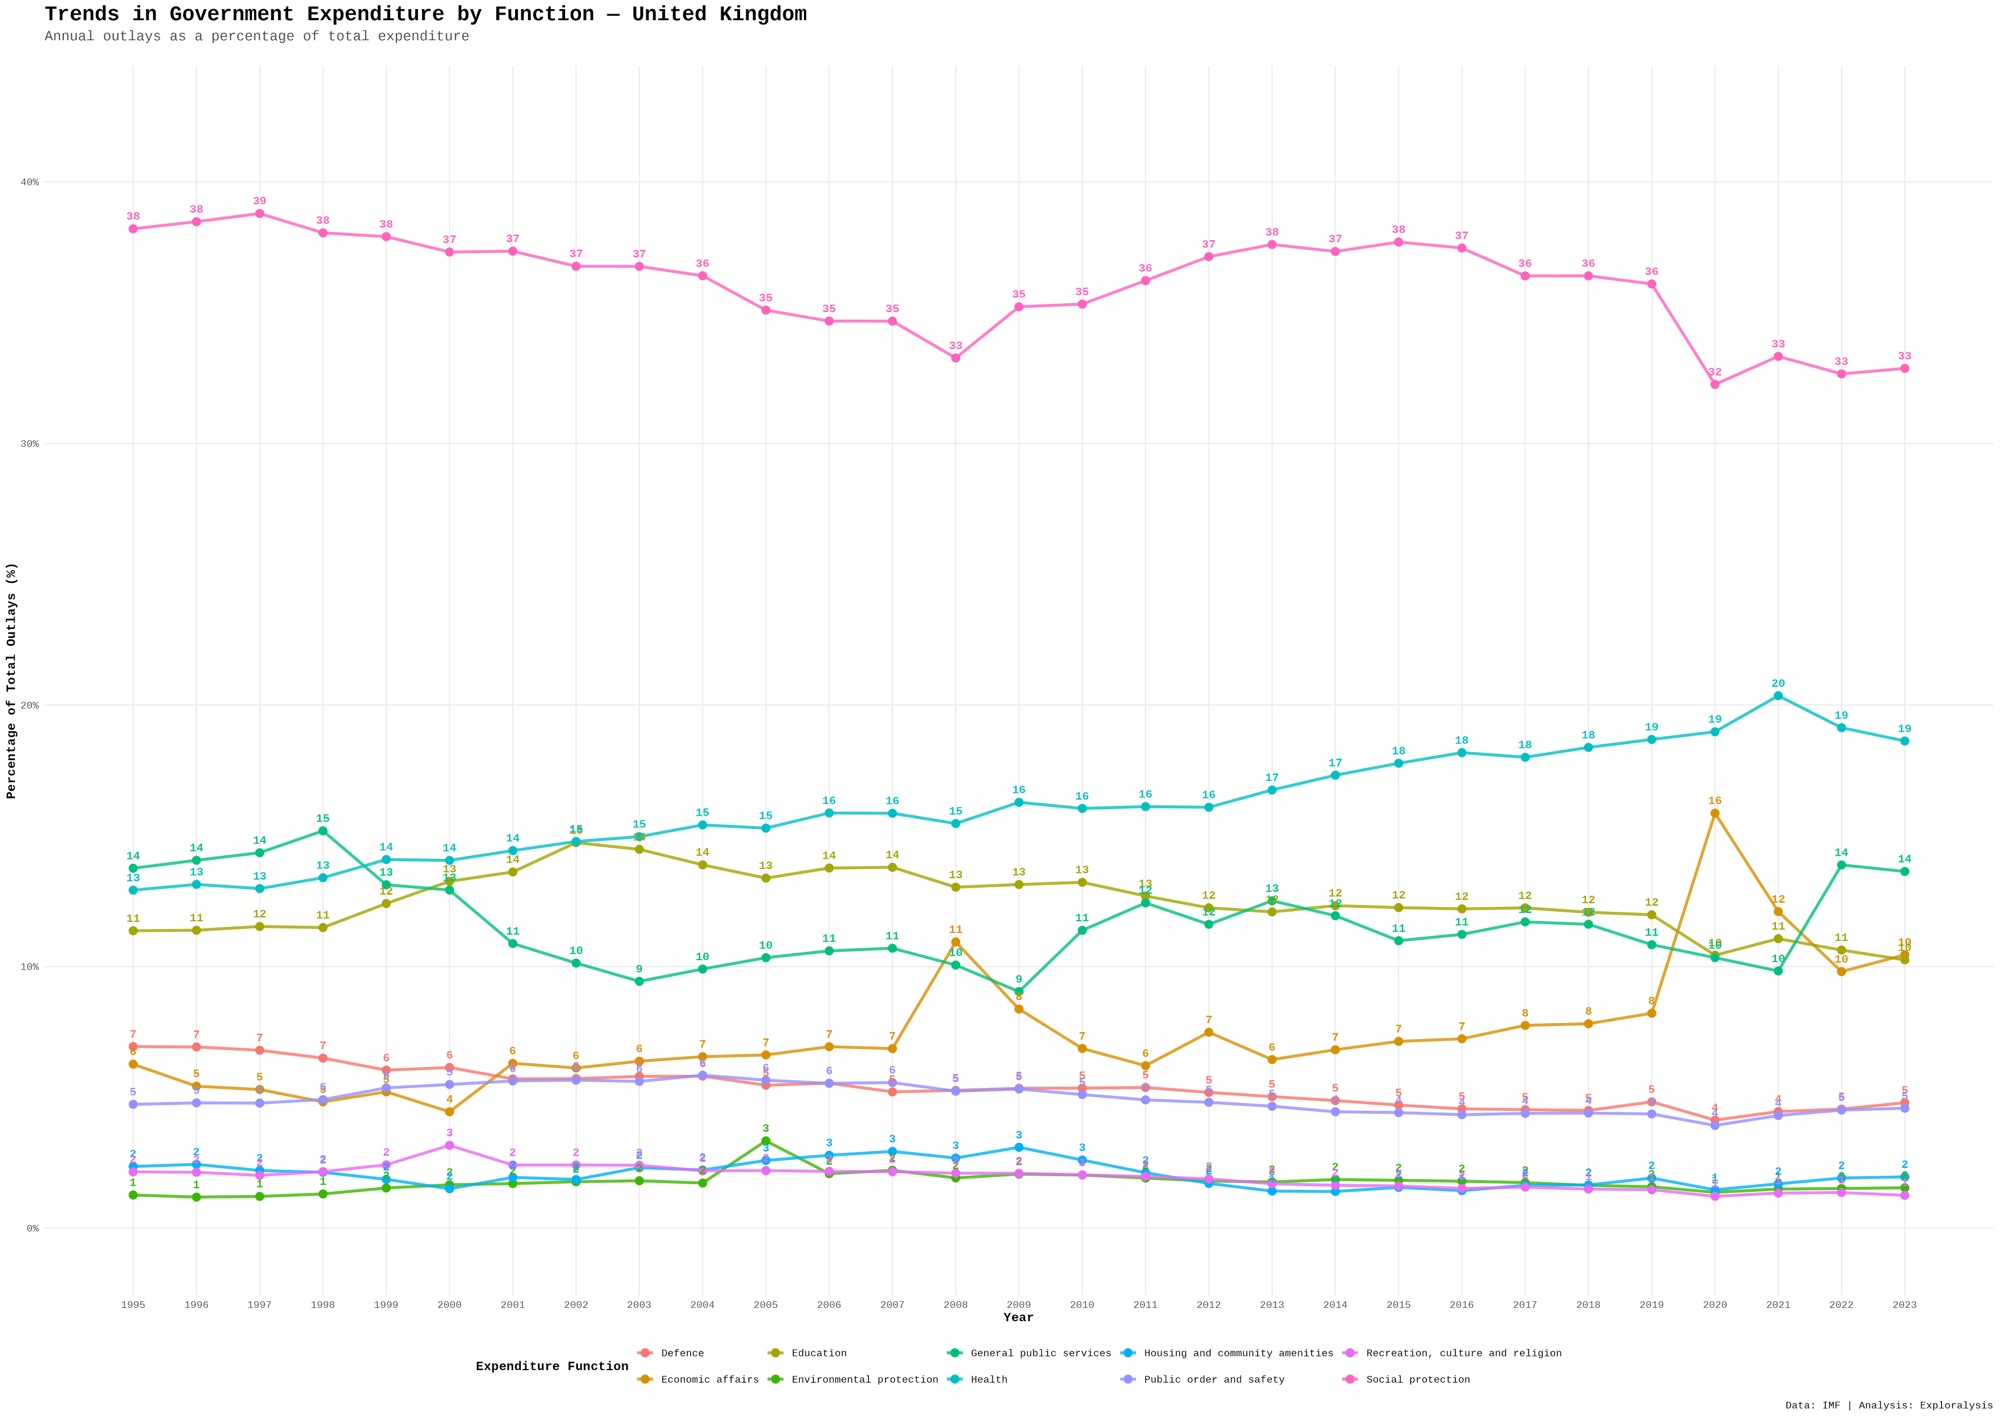
Line charts reveal gradual economic affairs increase since 2014. General public services jump in 2022. Health rises since 1995; social protection, education, and general public services show dynamics.
The UK balances welfare with economic responses to crises, reflecting a flexible yet welfare-oriented approach.
France Government Spending Analysis
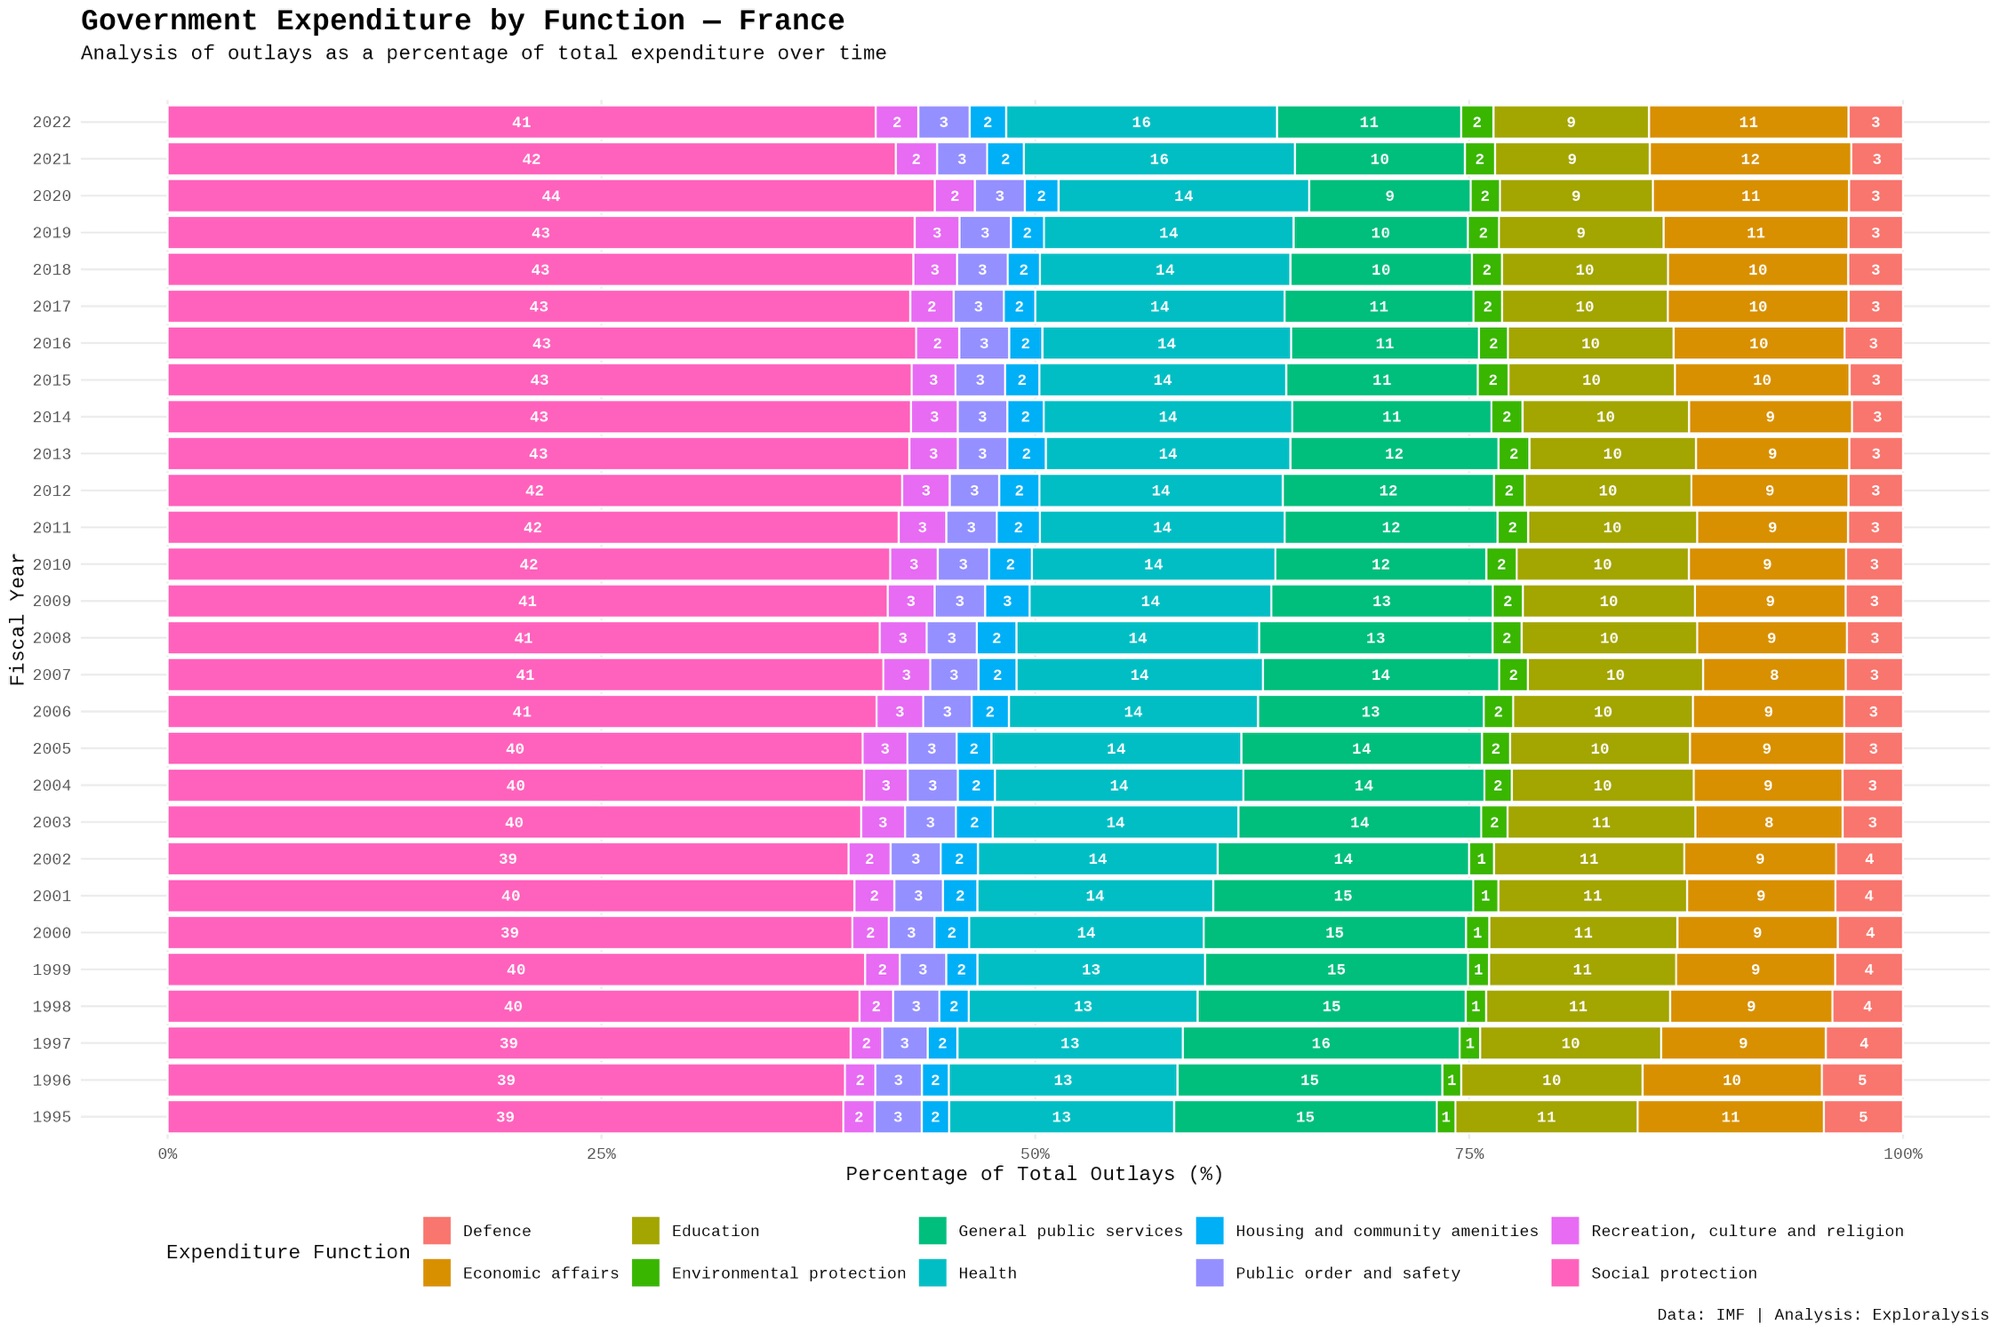
France’s dataset is from 1995 to 2022. Social protection exceeds 32%, followed by health and general public services, then education and economic affairs. Composition is constant.
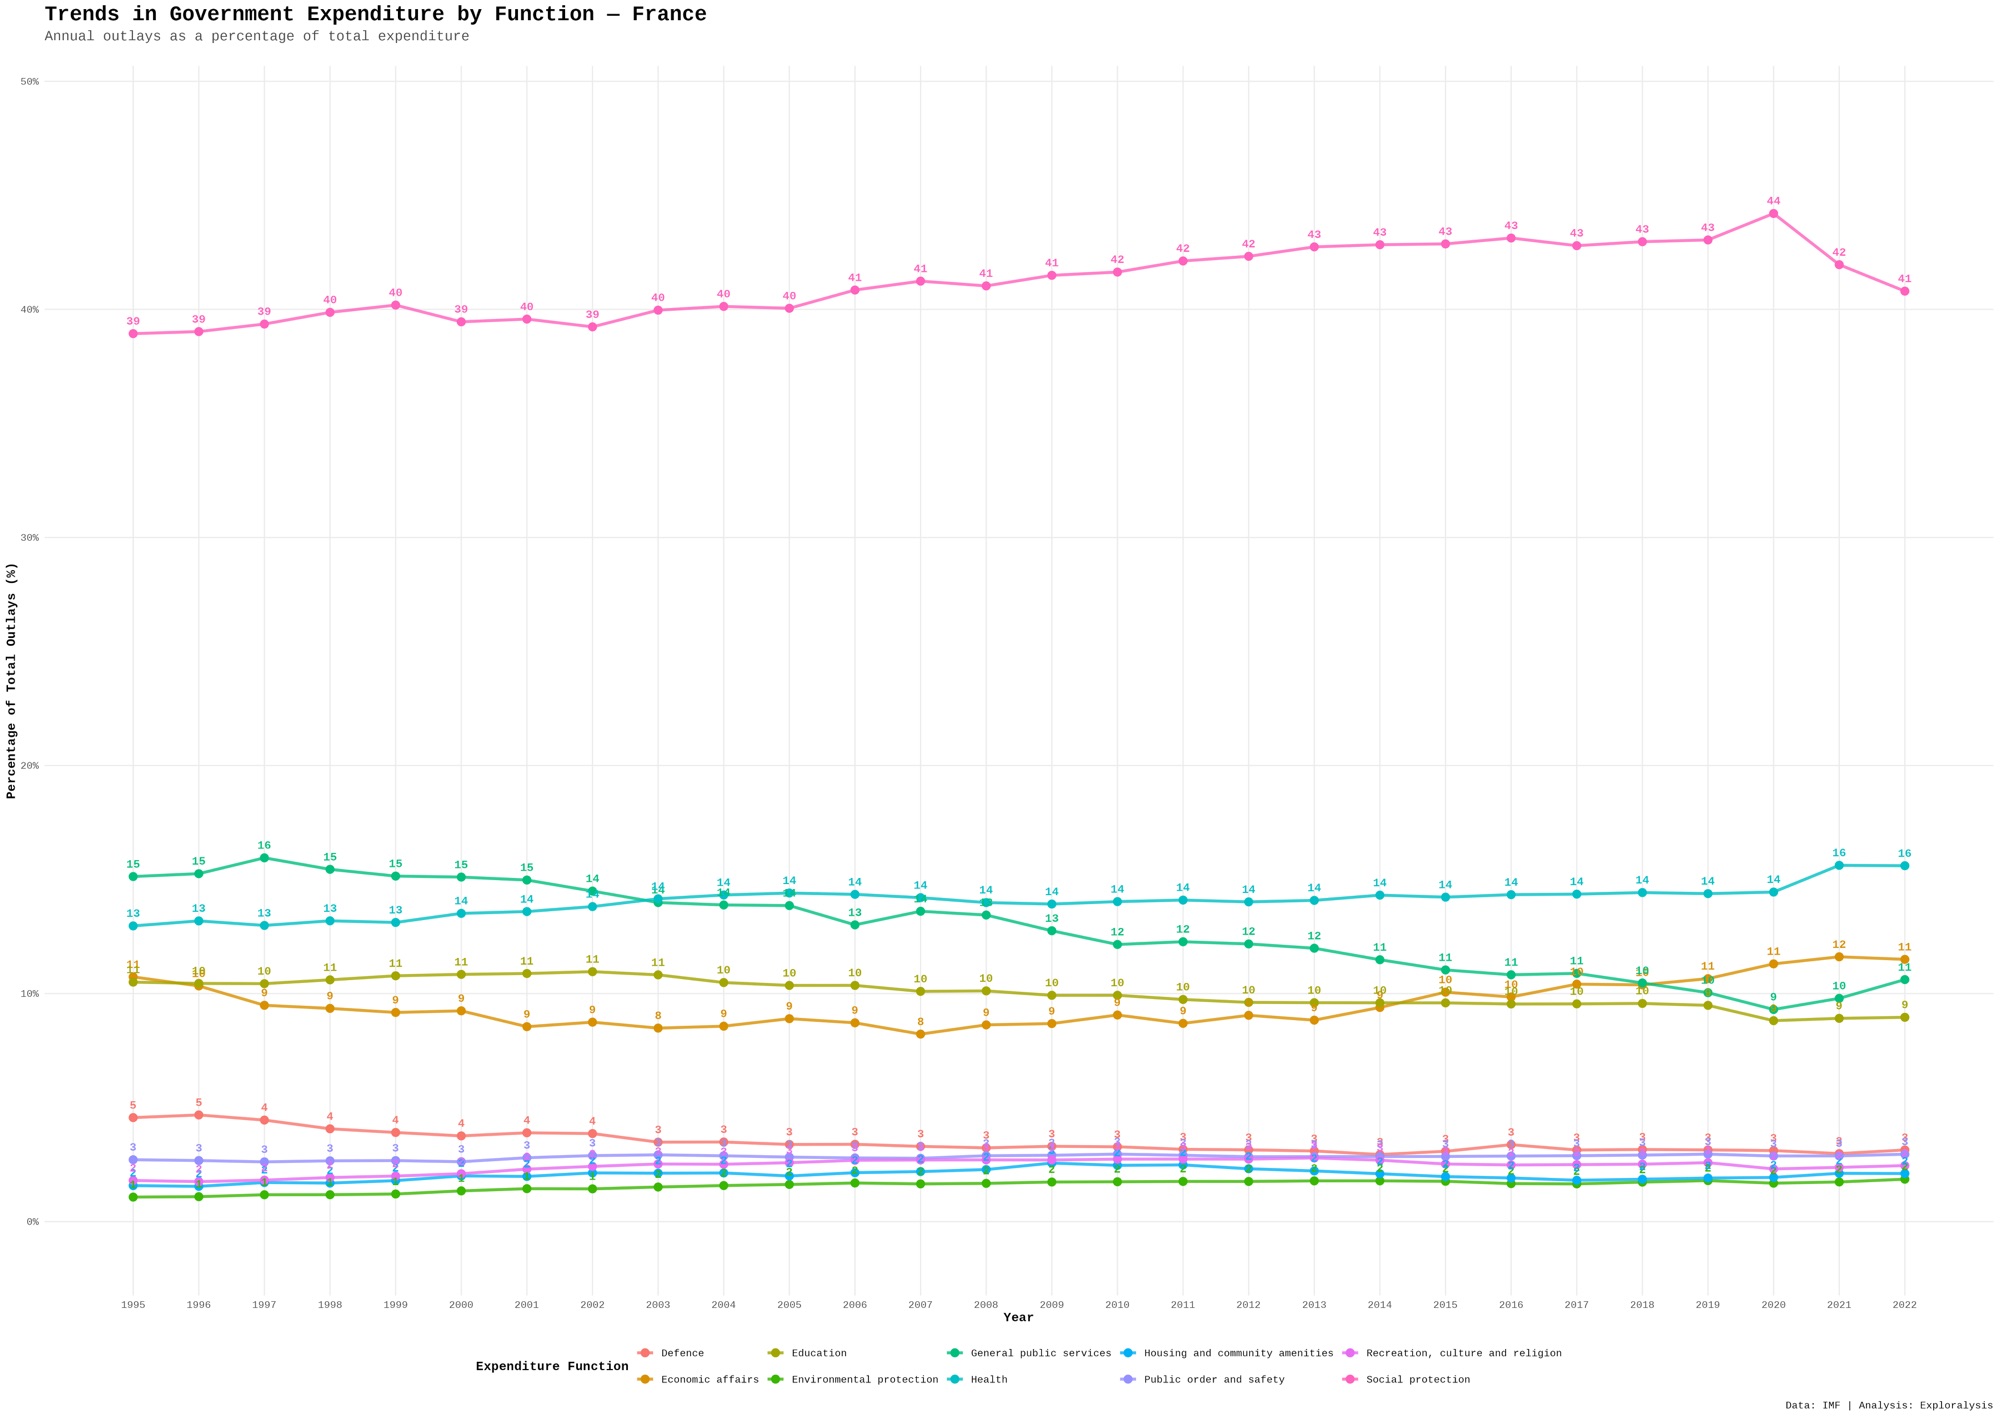
Line charts show slow social protection and economic affairs increases, general public services decrease. Others flat.
France’s high social spending underscores its social republic model, with gradual shifts for sustainability.
This concludes our detailed look at the first six countries: the U.S., China, Germany, Japan, the UK, and France. These analyses highlight diverse priorities, from U.S. defense to China’s economic focus. The other countries will be discussed in the next part.
End of Part 1
By: Nugroho Budianggoro
Cover photo by NHP&Co.