
This article analyzes imports, exports, and balance of trade data for 128 countries using United Nations international trade statistics (UN Data). The focus is on general trade system data, excluding special trade data, across selected years: 1995, 2005, 2010, 2015, 2021, 2022, and 2023.
The most important finding appears immediately: most countries run trade deficits rather than trade surpluses. Both the mean and median balance of trade values are negative, indicating that trade deficits are more common globally than trade surpluses.
Key Findings at a Glance
The average balance of trade is negative, with a mean of -5,694 million US dollars and a median of -1,714 million US dollars. China dominates global trade surpluses by a very wide margin. The United States records the largest trade deficit among the countries analyzed. Energy exporters and manufacturing powerhouses tend to have persistent trade surpluses. Large consumer economies tend to run long term trade deficits. A clear spike in 2022 and correction in 2023 reflects global shocks from the energy crisis and post pandemic demand shifts.
Understanding the Data
The dataset includes the following variables:
Imports measured in CIF terms, cost, insurance, and freight Exports measured in FOB terms, free on board Balance of trade, calculated as exports minus imports All values are expressed in millions of US dollars.
Only countries reporting general trade system data are included, resulting in a sample of 128 countries.
Global Balance of Trade Distribution
When examining balance of trade values across all countries, both the mean and median are negative. This shows that more countries import more goods than they export, even though a small number of countries record very large surpluses.
This imbalance is heavily influenced by a few extreme cases, especially China on the surplus side and the United States on the deficit side.
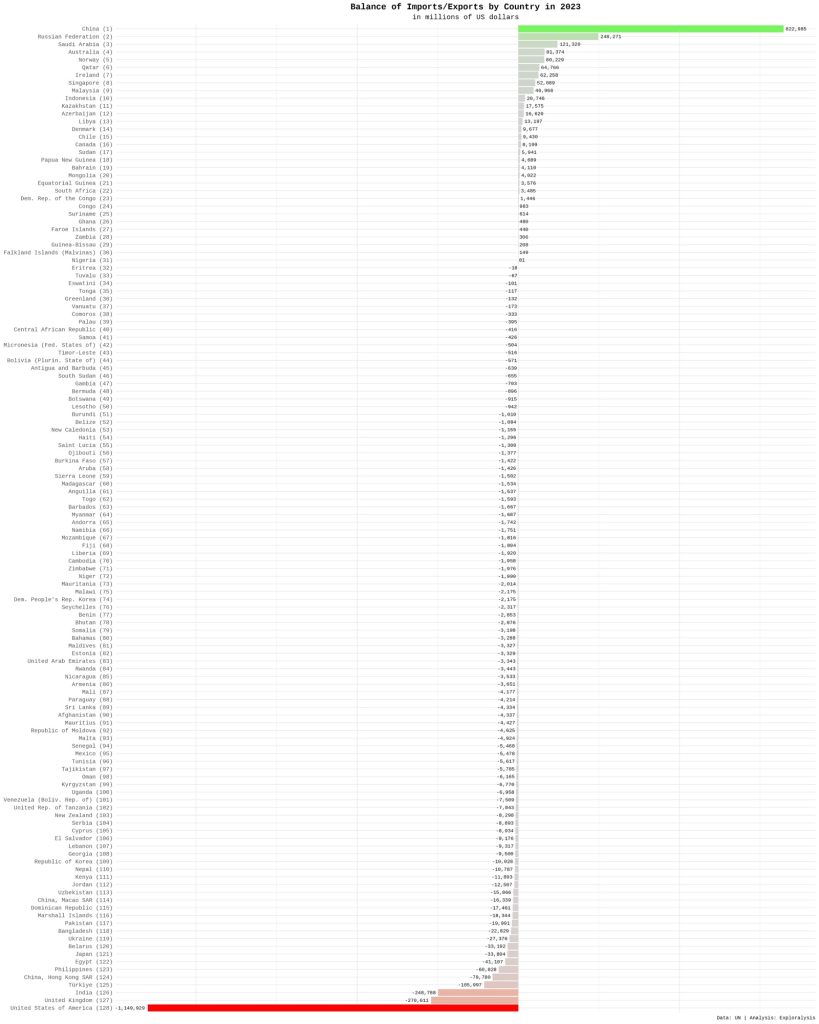
Top 10 Countries by Balance of Trade in 2023
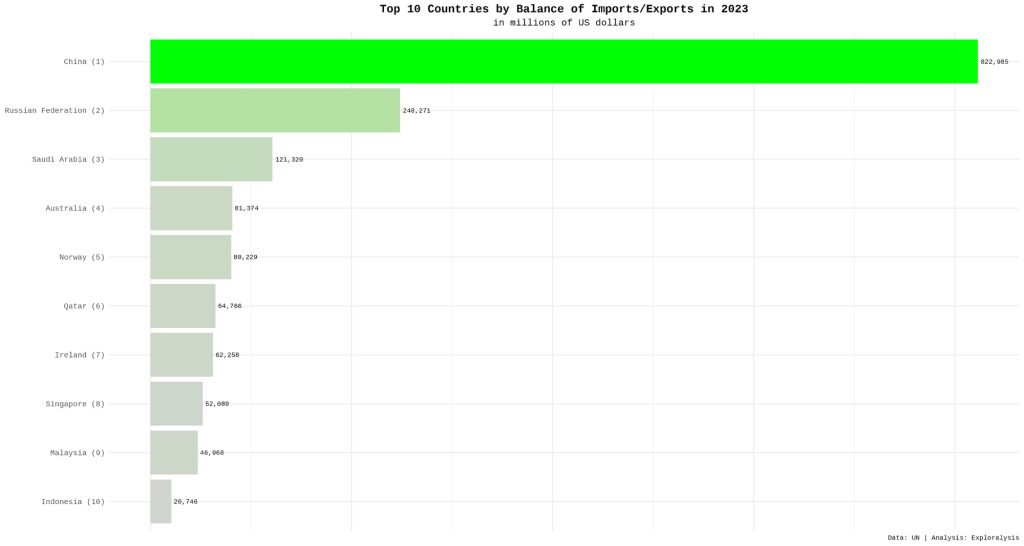
From highest to lowest surplus, the top 10 countries in 2023 are: China, Russia, Saudi Arabia, Australia, Norway, Qatar, Ireland, Singapore, Malaysia, Indonesia.
China stands far above all others with a trade surplus of approximately 823,000 million US dollars, reflecting its role as the world’s largest exporter of manufactured goods.
Bottom 10 Countries by Balance of Trade in 2023
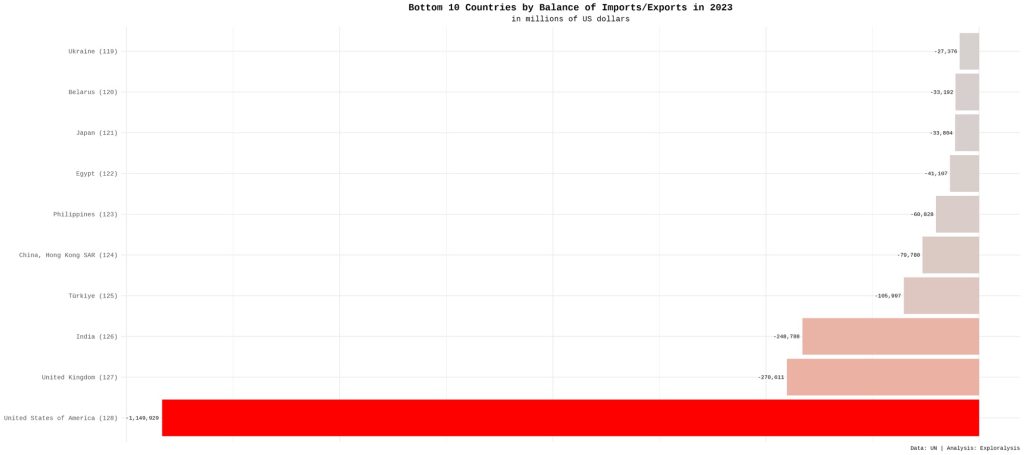
From largest deficit to smaller deficits, the bottom countries are: United States, United Kingdom, India, Turkey, Hong Kong, Philippines, Egypt, Japan, Belarus, Ukraine.
The United States records the largest deficit at around -1,150,000 million US dollars, highlighting its position as the world’s largest importer.
Why Top and Bottom Countries End Up Where They Are
Surplus Countries
China benefits from strong manufacturing, consumer goods, and high technology exports. Russia relies heavily on oil, gas, and commodity exports. Saudi Arabia dominates petroleum and petrochemical exports. Australia exports iron ore, LNG, coal, and agricultural products. Norway has strong gas and seafood exports.
These countries export products that are either globally essential or hard to substitute, which supports persistent trade surpluses.
Deficit Countries
United States imports large volumes of electronics, automobiles, oil, and consumer goods. The US dollar’s role as the global reserve currency makes imports cheaper and exports relatively more expensive. United Kingdom runs a structural goods deficit despite a surplus in services such as finance and professional services. India imports large amounts of crude oil, electronics, gold, and machinery. Turkey depends on imported energy, raw materials, and intermediate goods. Hong Kong acts as a major re export hub, importing goods that are then exported elsewhere. Global slowdowns, especially in 2023, temporarily widened its deficit.
High Trade Volume, Low Net Balance Countries
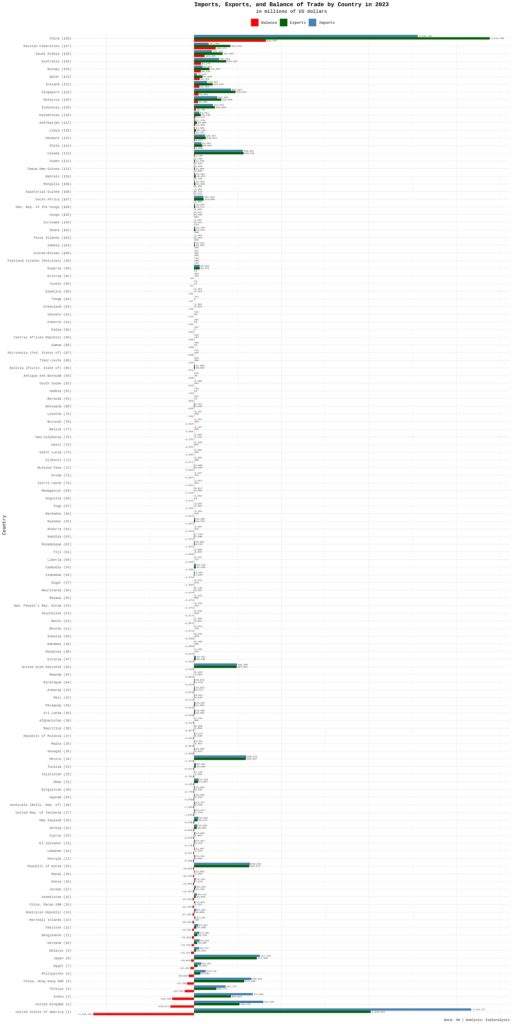
A grouped bar chart comparing imports, exports, and balance of trade reveals an important pattern.
Most countries with small balance of trade values also have relatively low imports and exports. However, several countries show high imports and high exports that nearly cancel each other out, resulting in a small net balance.
Notable examples include: Singapore, Malaysia, Indonesia, Canada, United Arab Emirates, Mexico, South Korea, Japan, Hong Kong.
For these countries, even a small reduction in imports or exports could significantly change their balance of trade.
Time Series Trends for Top and Bottom Countries
China
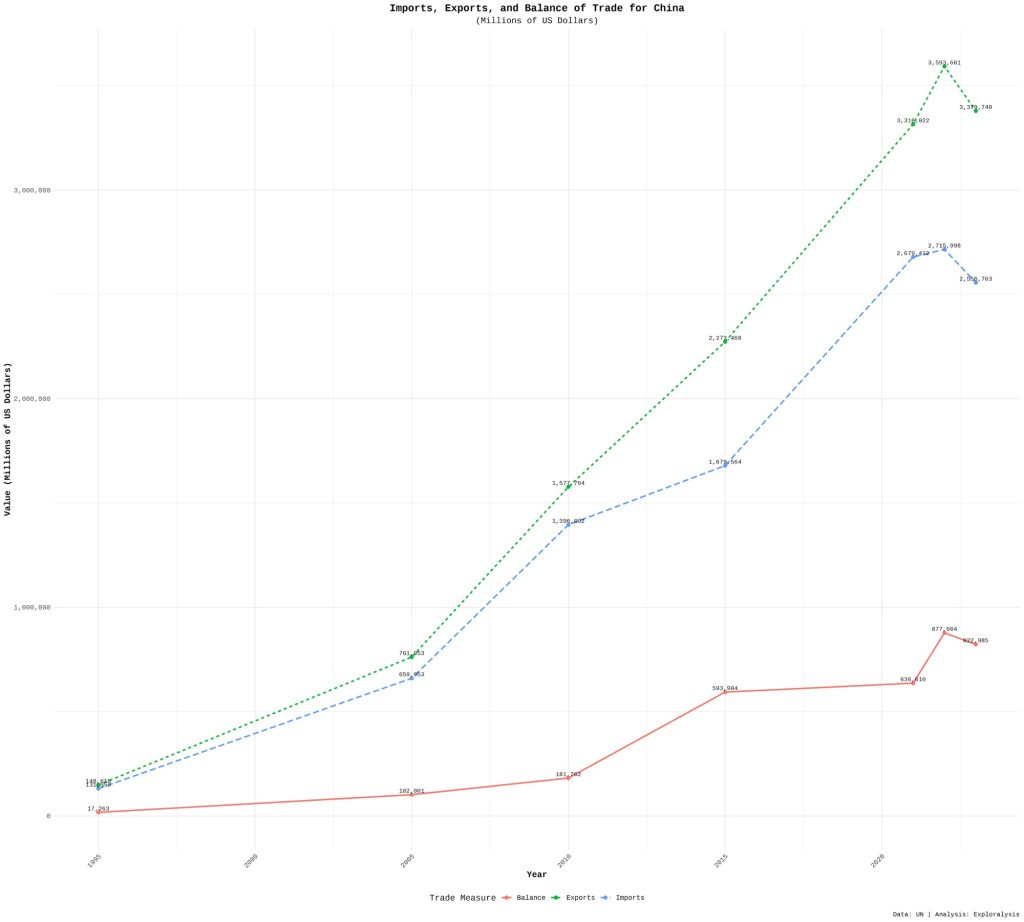
China shows a strong rise in exports, imports, and balance of trade since 2015. Exports consistently exceed imports. A peak appears in 2022, followed by a decline in 2023.
Russia
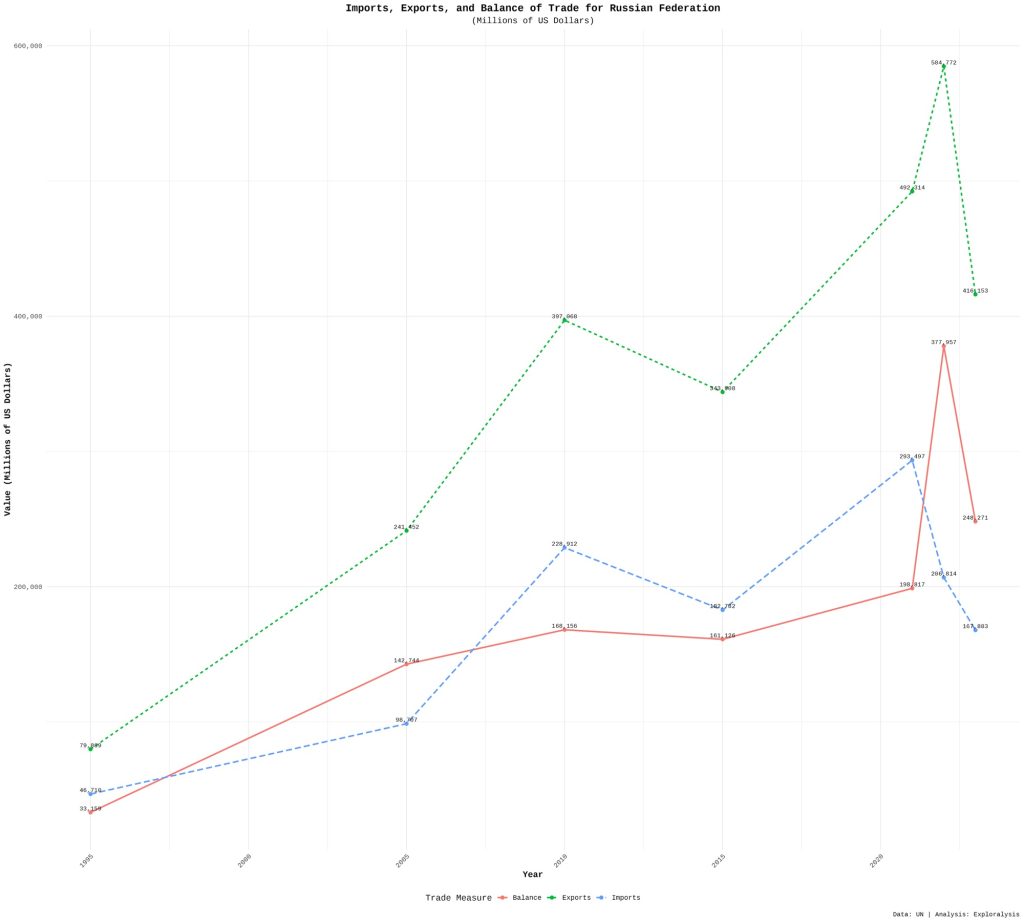
Russia’s exports and trade surplus rise steadily over time. In 2022, exports surged while imports dropped sharply, causing a major spike in surplus. Both declined in 2023.
Saudi Arabia
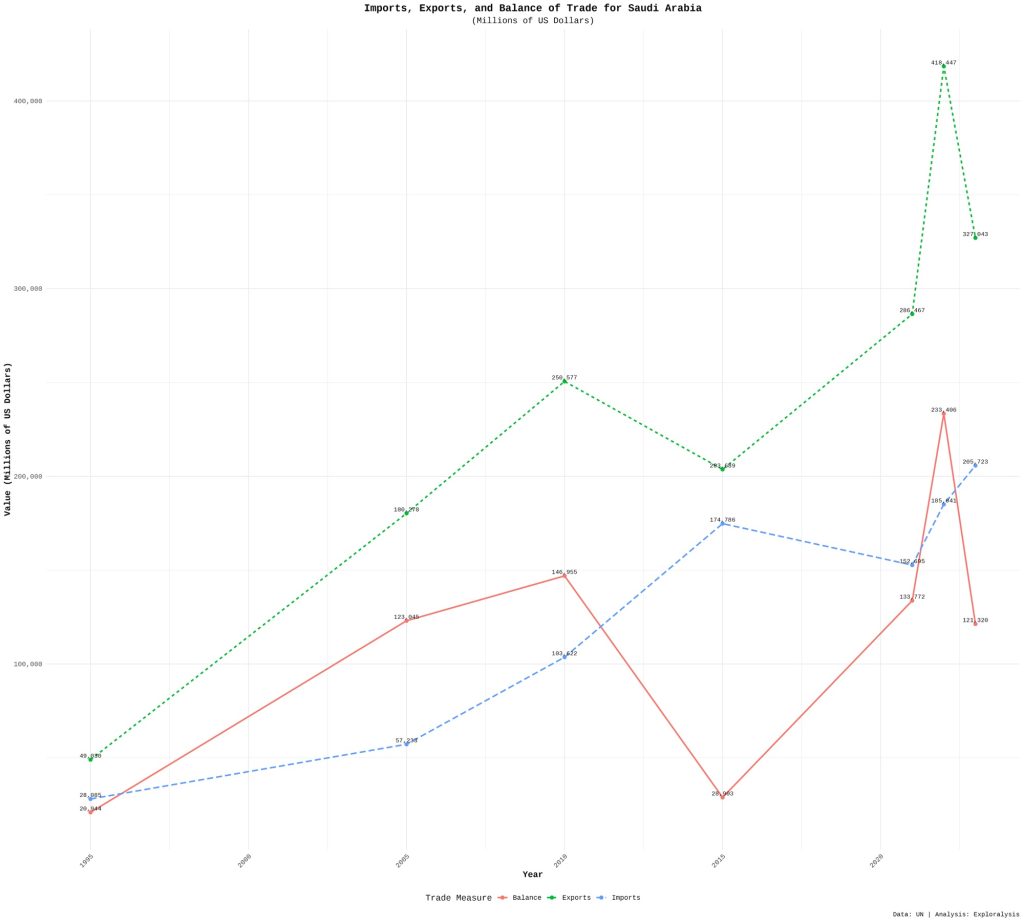
Saudi Arabia maintains a positive balance of trade throughout the period. A dip occurs in 2015 due to rising imports and falling exports. Like other surplus countries, it peaks in 2022 and dips in 2023.
Australia
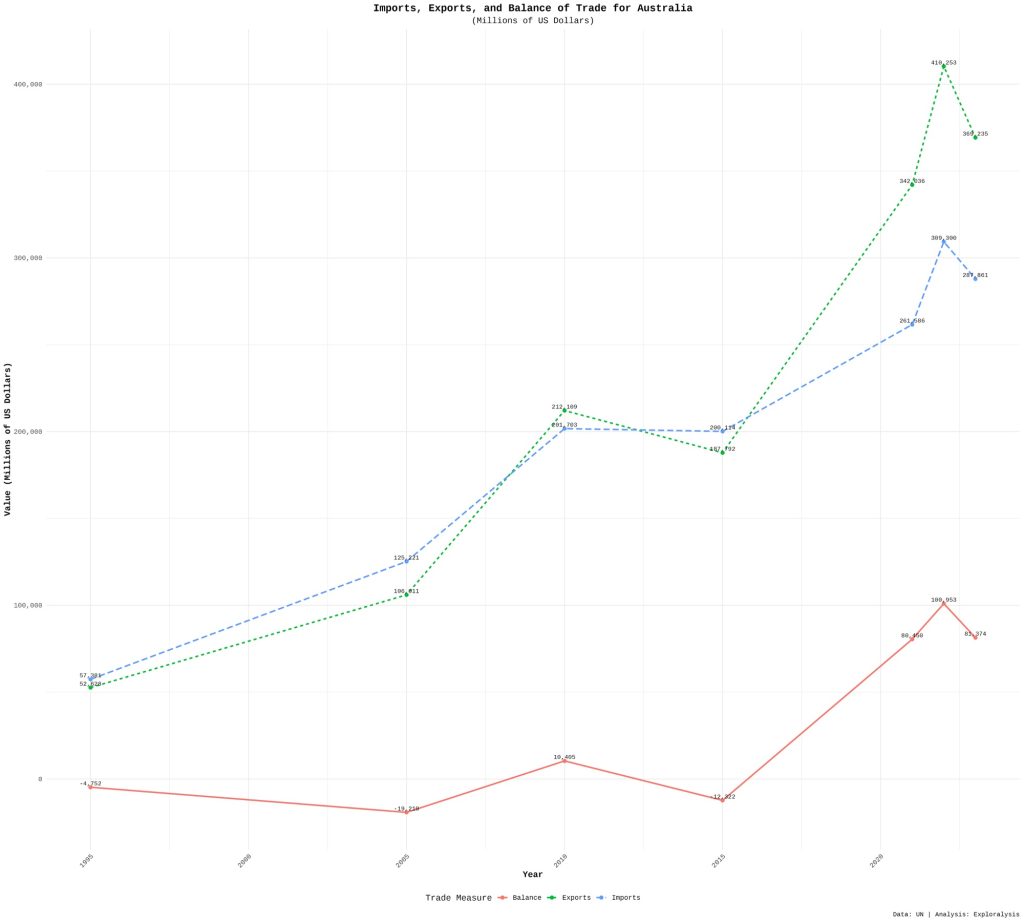
Australia moves from a negative balance in 1995 to a strong surplus by 2023. It still records deficits in 2005 and 2015. The 2022 peak and 2023 dip pattern is also visible.
Norway
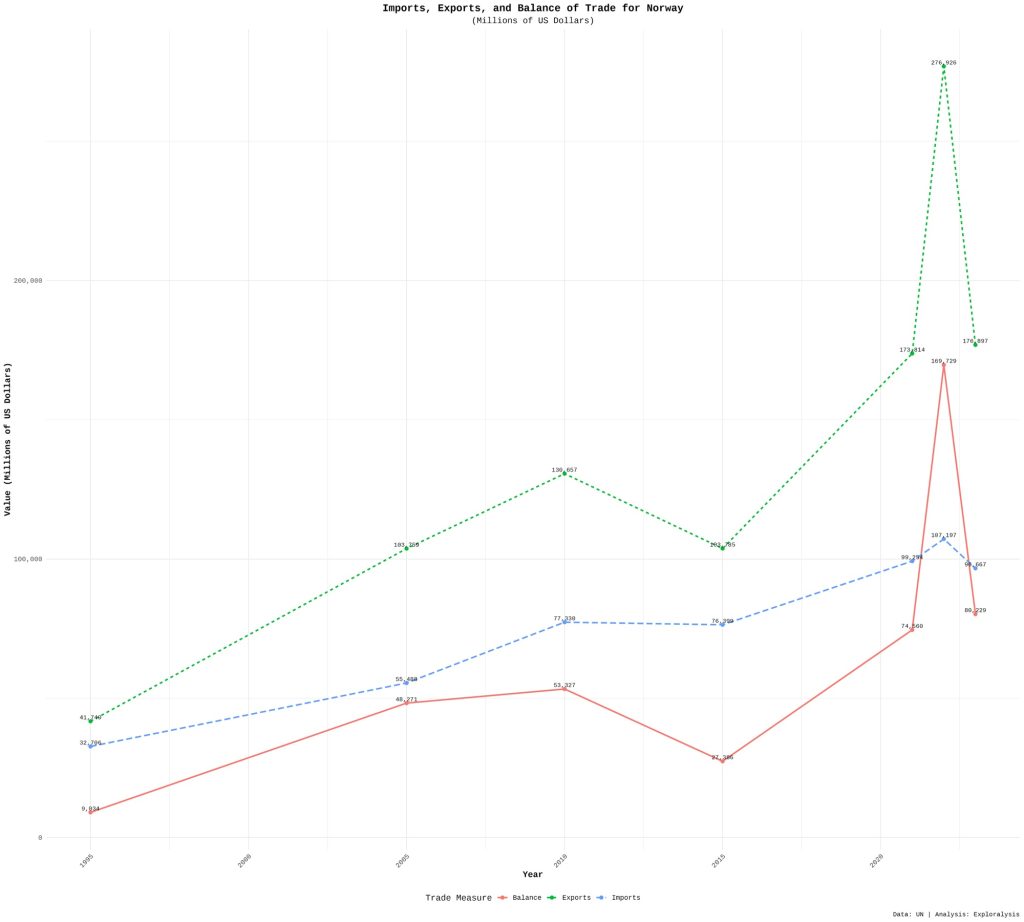
Norway consistently records a positive and rising balance of trade. A small export dip occurs in 2015, followed by the familiar 2022 peak and 2023 correction.
United States
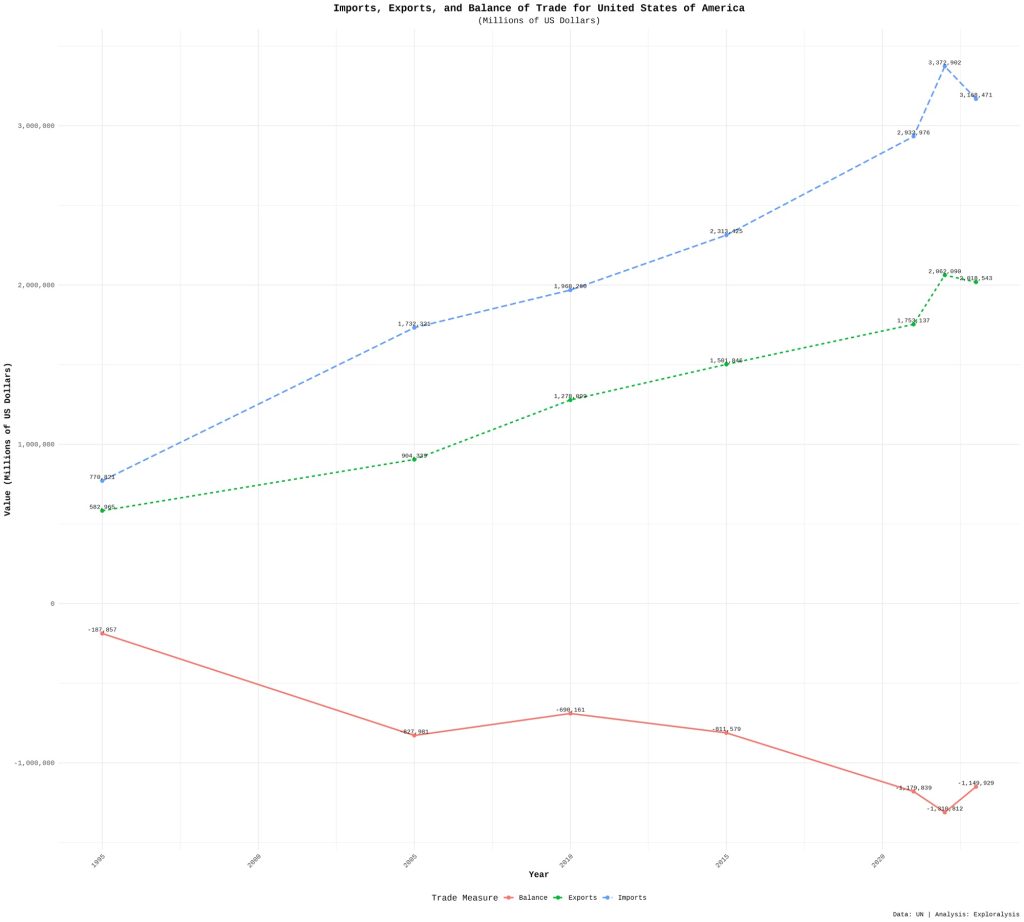
The US has a negative balance of trade in every year. The gap between imports and exports widens steadily. Imports peak in 2022 and fall in 2023, suggesting that US demand absorbed the export surges of surplus countries.
United Kingdom
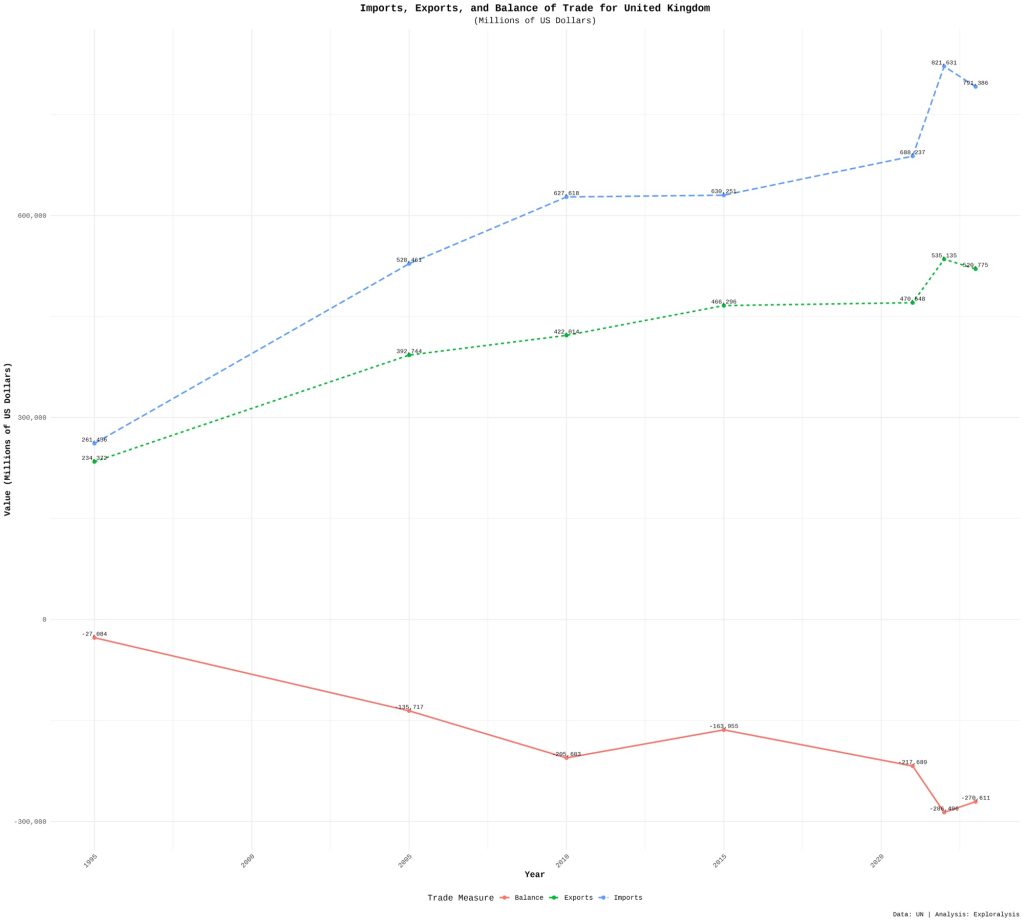
The UK consistently runs a trade deficit. Imports and exports trend upward, with a strong rise in 2022 and a dip in 2023.
India
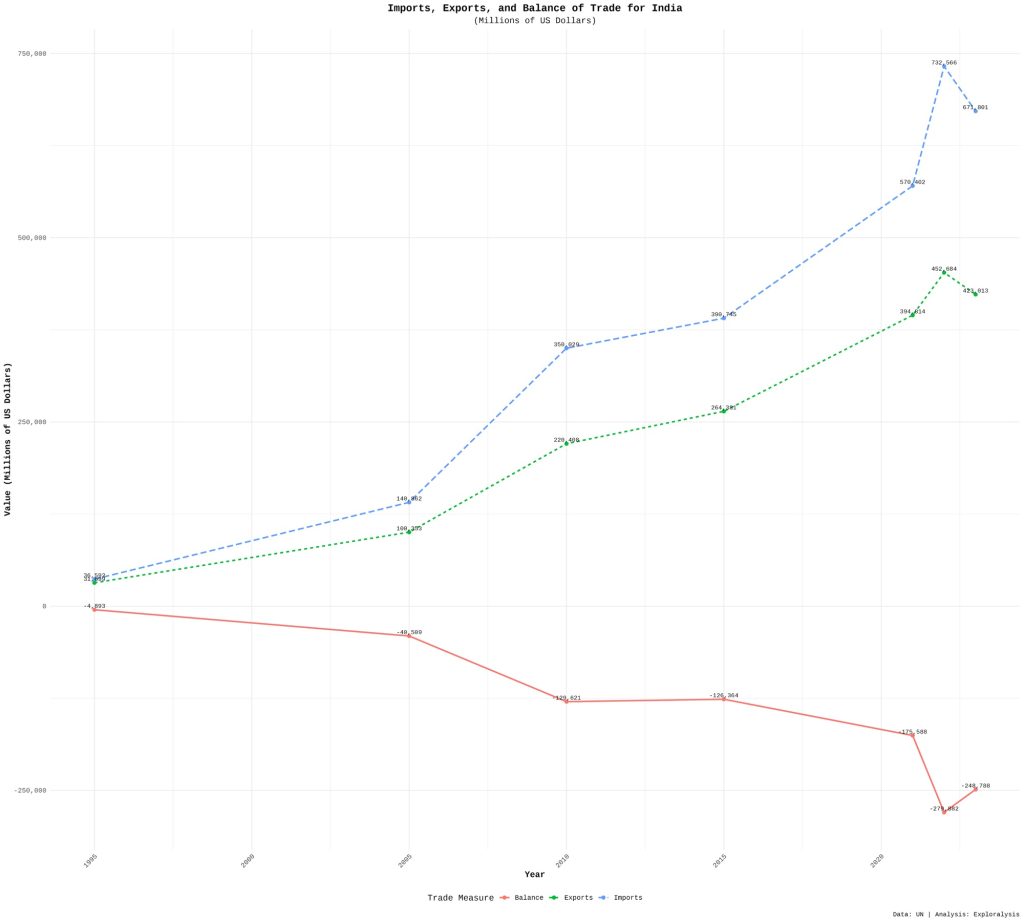
India’s imports and exports rise steadily, but imports grow faster, especially after 2021. This widens the trade deficit starting in 2022.
Turkey
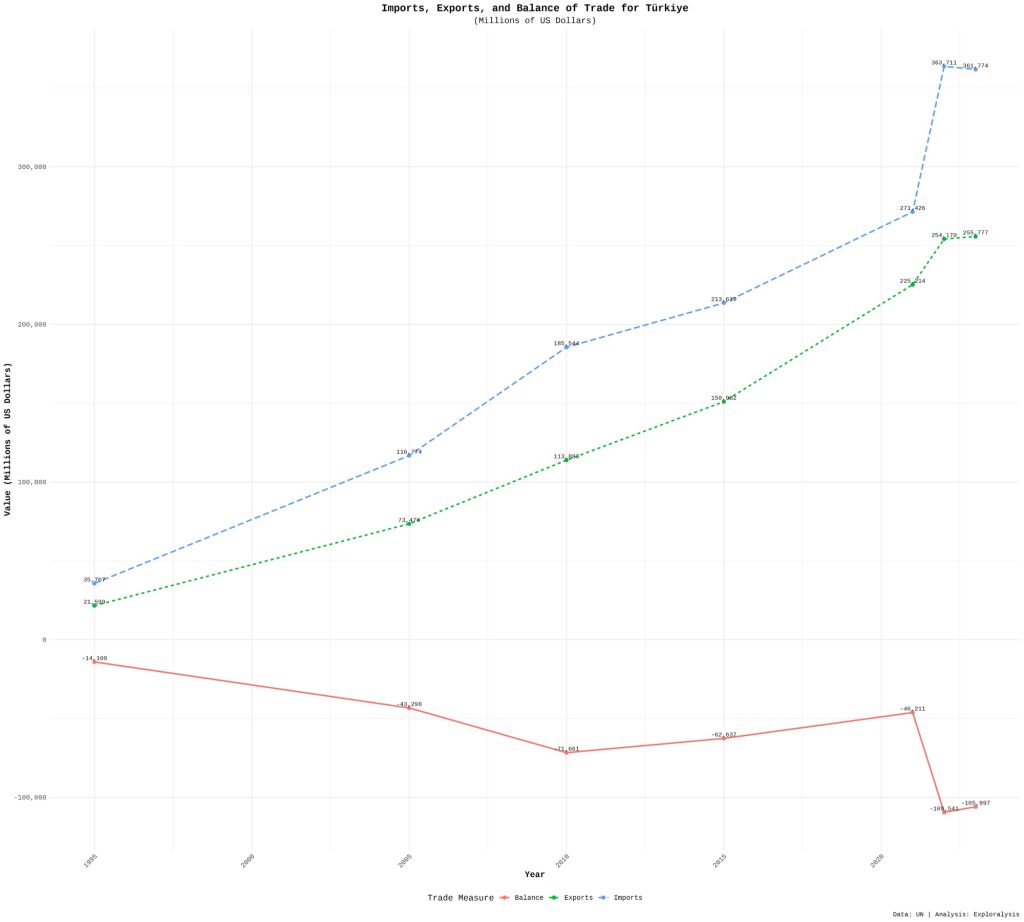
Turkey’s exports and imports rise until 2021. In 2022, imports surge while exports remain on trend, pushing the trade deficit deeper.
Hong Kong
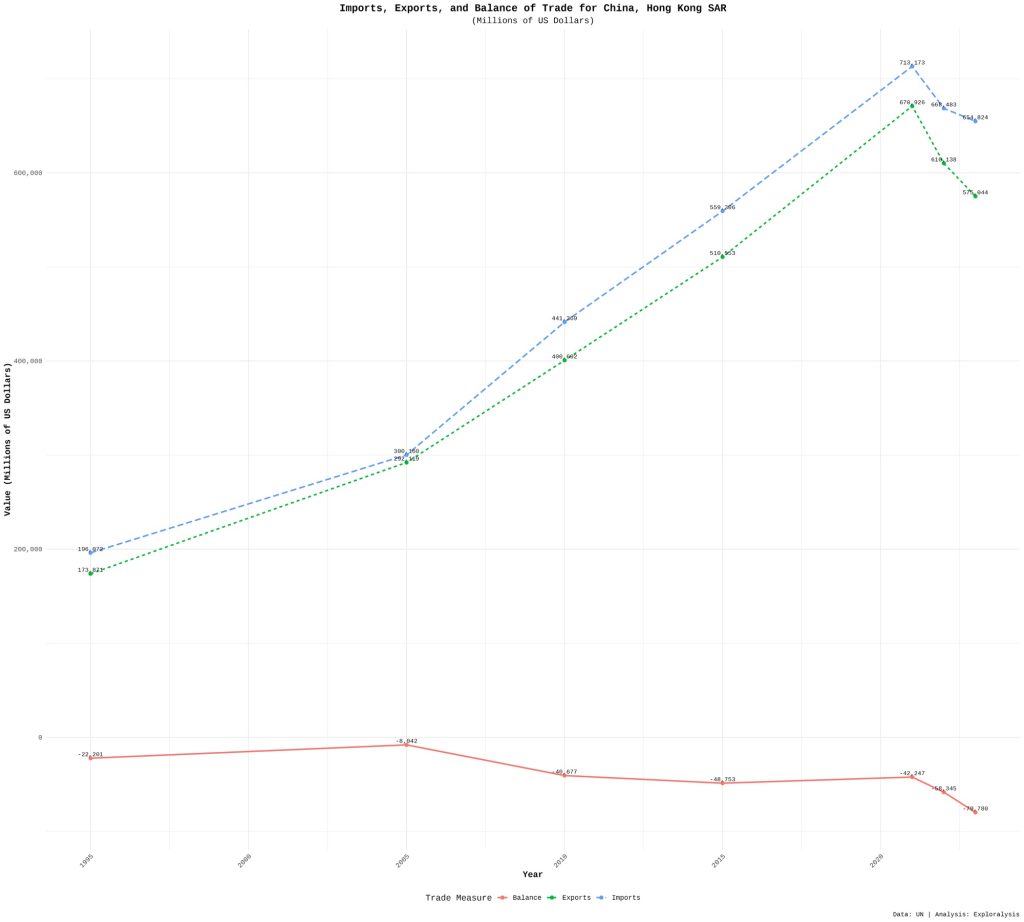
Hong Kong’s exports and imports move closely together. Both rise until 2022 and fall in 2023. Despite high trade volumes, the balance of trade remains negative.
Long Term Patterns and Global Shocks
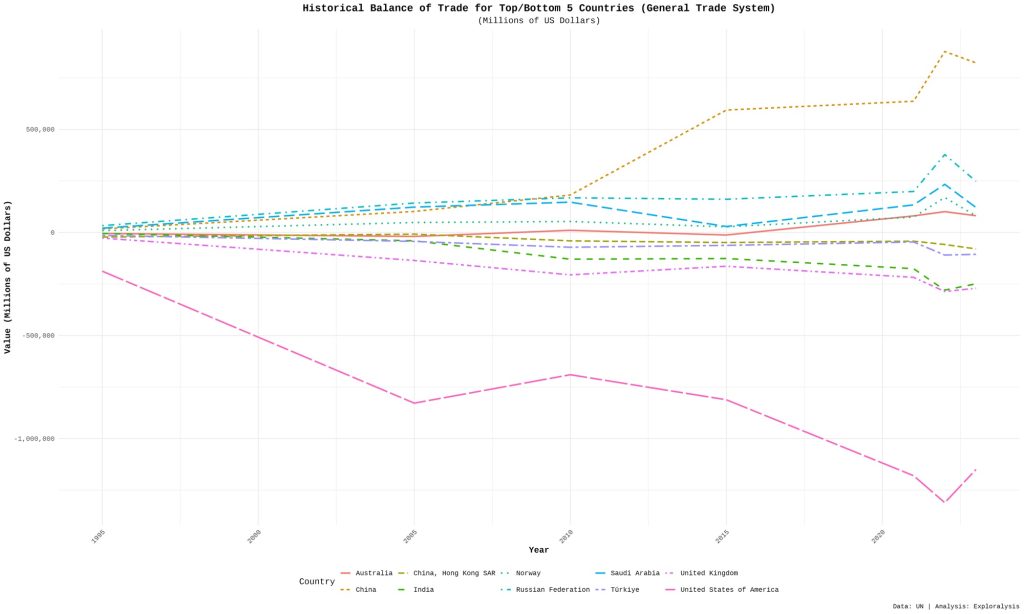
Excluding China and the United States, most countries show relatively stable balance of trade trends over time. China’s surplus accelerates after 2015, while the US deficit deepens steadily since 1995.
A clear global pattern appears in 2022:
- Surplus countries reach a peak
- Deficit countries reach a trough
This reflects global economic interconnection, where surplus countries export heavily to deficit countries.
Why 2022 Was So Extreme
The sharp spike in 2022 and correction in 2023 can be explained by two major factors:
- The commodity and energy price surge following the Russia Ukraine war
- Post COVID 19 demand shifts, where global demand for goods rose sharply before normalizing
Final Insights
China currently holds the strongest position in global merchandise trade, followed by resource rich exporters such as Russia and Saudi Arabia. Large consumer economies like the United States, United Kingdom, and India show persistent trade deficits that are unlikely to reverse without structural change.
Countries with high imports and exports but small net balances are highly sensitive to trade shocks. Overall, the persistent divide between surplus and deficit countries suggests that global trade positions are stable and slow to change, even during major economic disruptions.
by: Nugroho Budianggoro
Cover photo by Julius Silver