
Global Education Enrollment Analysis Using 2022 United Nations Data
This article presents a comprehensive analysis of primary and secondary education enrollment statistics around the world, based on the most recent data from the United Nations (2022). The focus is on understanding education access through the lens of the gross enrollment ratio (GER) across different education levels and analyzing how these metrics relate to GDP per capita, population, and gender parity.
Overview of the Dataset
The dataset includes statistics for individual countries, regions, and continents, and also provides a global overview. Key variables in the dataset include:
Number of students enrolled in:
Primary education (ages 6–11)
Lower secondary education (ages 12–14)
Upper secondary education (ages 15–17)
Gross enrollment ratios (GER) for males and females at each education level
Additional data used in the analysis includes GDP (current prices), GDP per capita (2022), and total population (2022), also sourced from the United Nations. Note: Some countries, such as China, are not included in this dataset.
What Is Gross Enrollment Ratio?
The gross enrollment ratio is a key metric in international education analysis. It represents the total number of students enrolled in a given level of education, regardless of age, expressed as a percentage of the official school-age population for that level. GER can exceed 100 percent due to underage and overage students who enroll early or late.
To provide a more complete view, we calculated the average GER across both genders, and the Gender Parity Index (GPI) for each education level. GPI is calculated as:
GPI = Female GER / Male GER
A GPI greater than 1 indicates enrollment favors females.
A GPI less than 1 suggests male-dominant enrollment.
A GPI around 1 indicates gender balance.
While the average GER provides a general snapshot, it can be skewed in countries where there is a large gender imbalance in the population.
Global Enrollment Patterns by Level and Gender
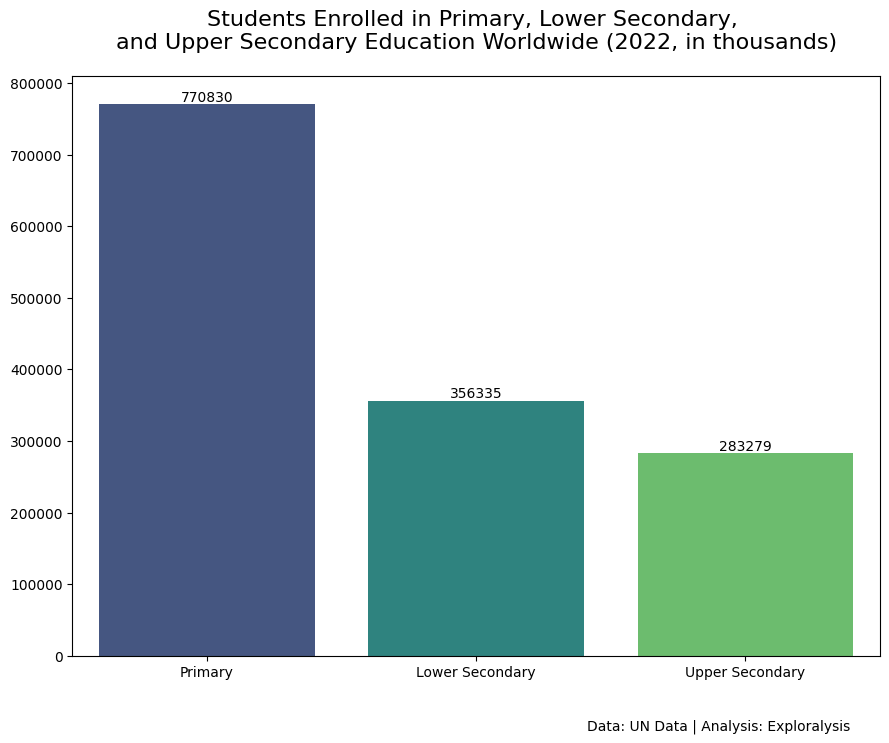
Globally, primary education sees the highest number of enrolled students. Enrollment numbers decrease significantly in secondary education:
Lower secondary enrollment is less than half the number in primary education.
Upper secondary enrollment is slightly below that of lower secondary.
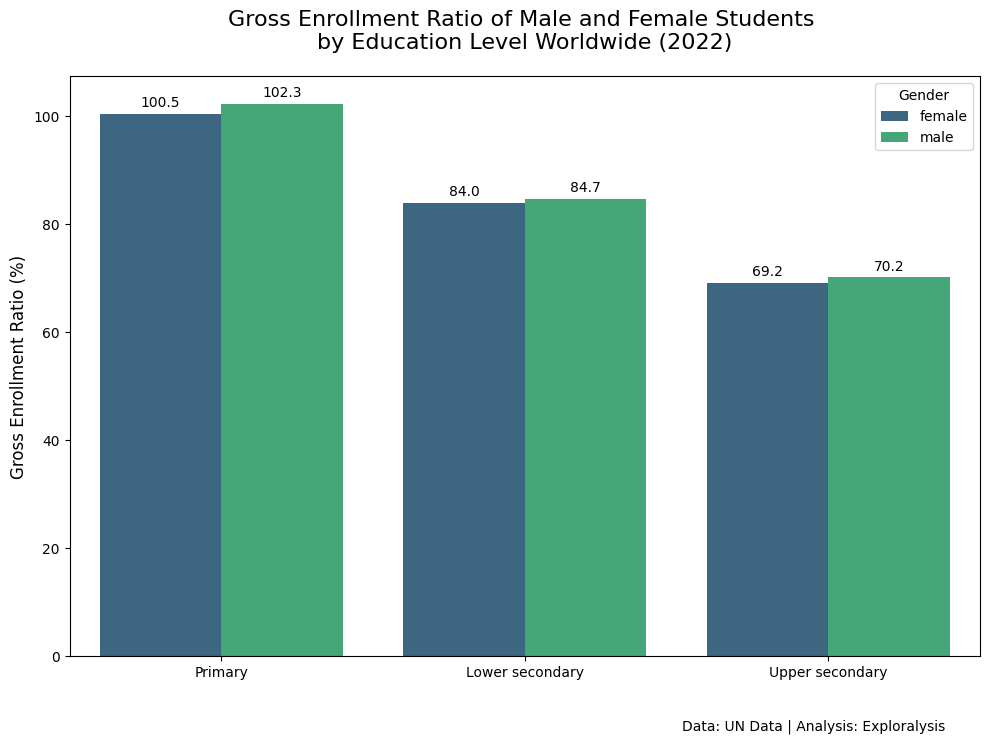
When broken down by gender, the global GER for males is consistently slightly higher than that for females across all education levels. However, the differences are minor, indicating near-gender parity in school enrollment at the global level.
Education Enrollment Disparities Across Countries
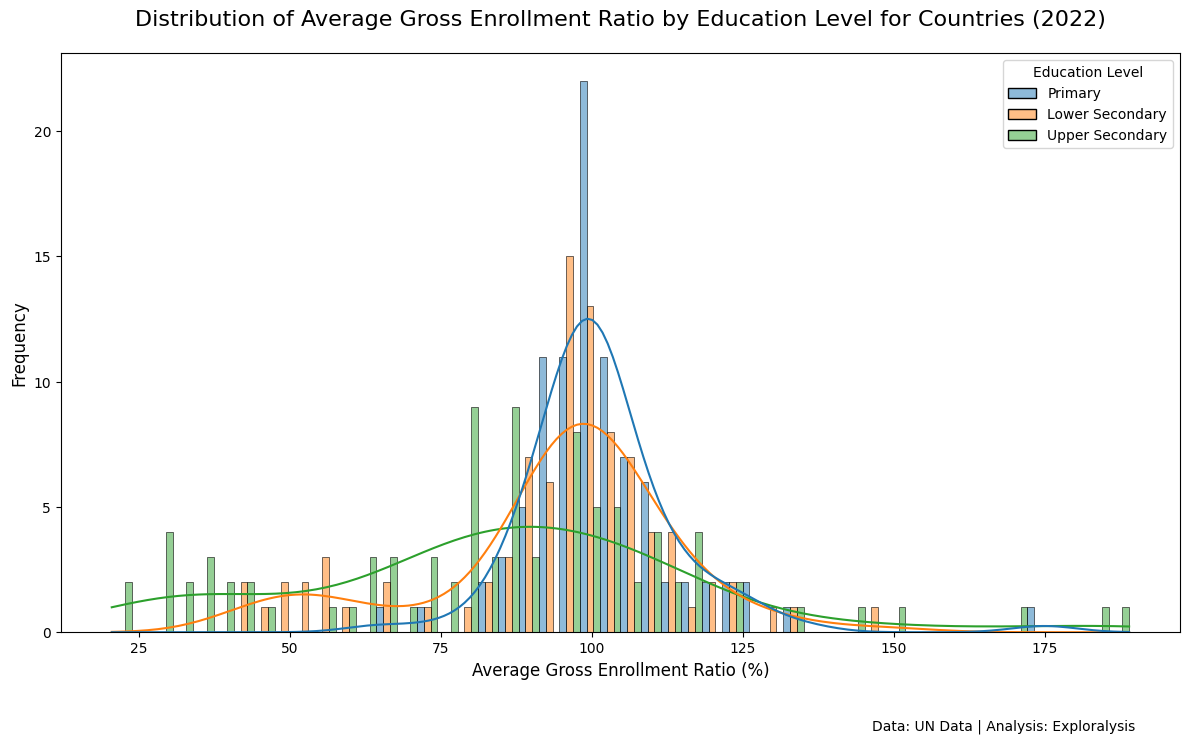
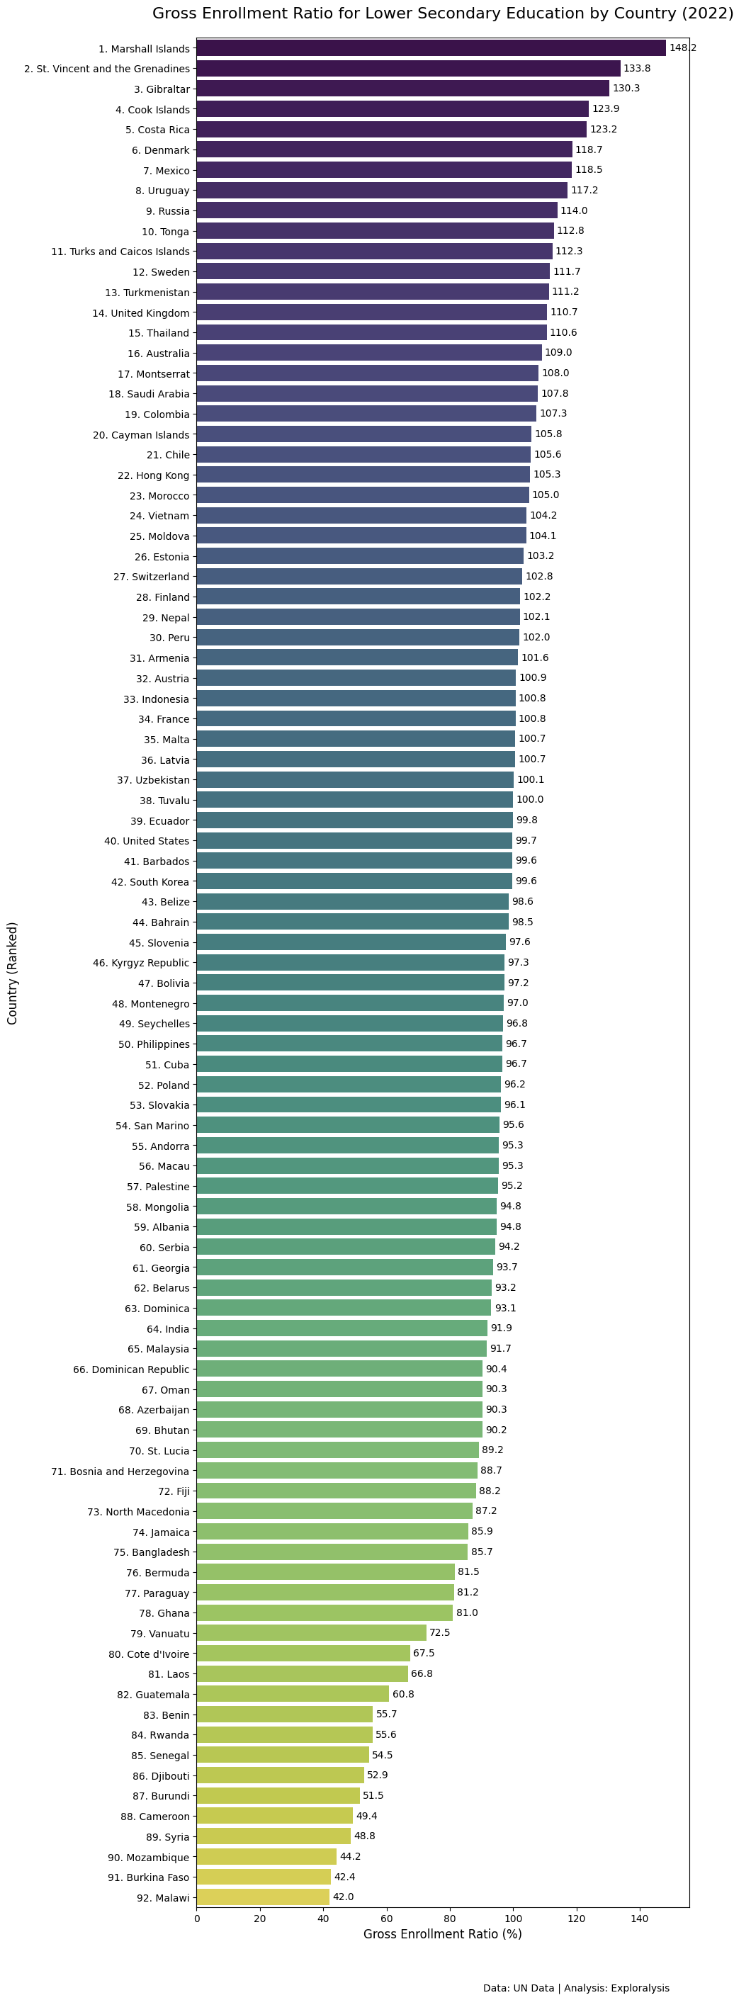
Despite global parity, country-level data reveals more complexity. Histograms of GER by country show that:
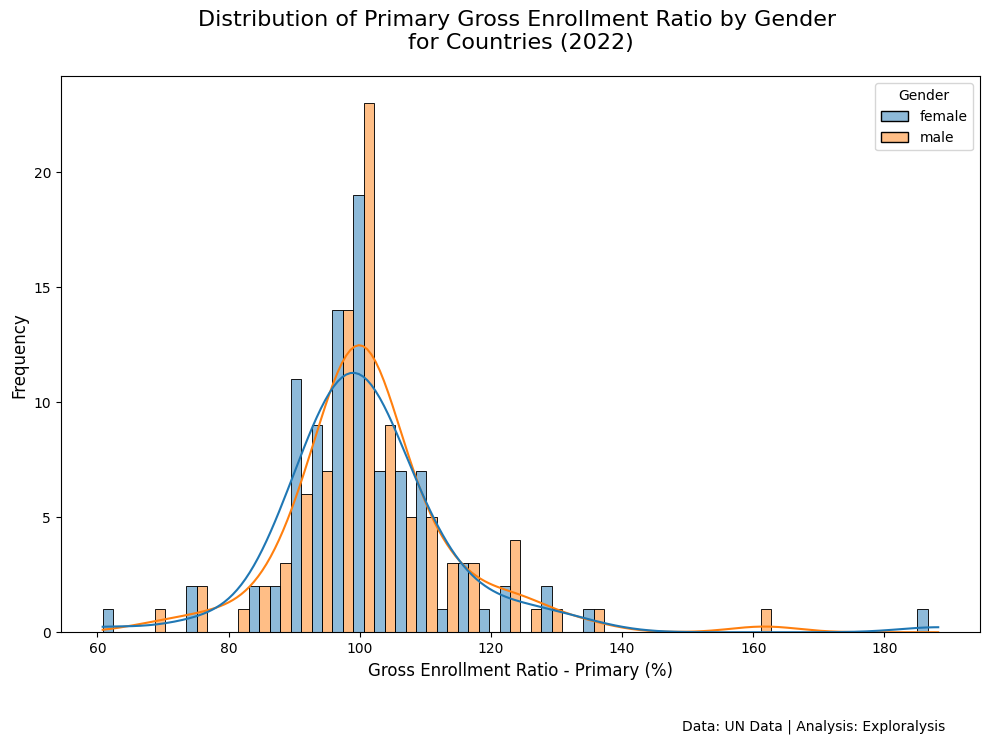
Primary education GER values are concentrated near 100 percent.
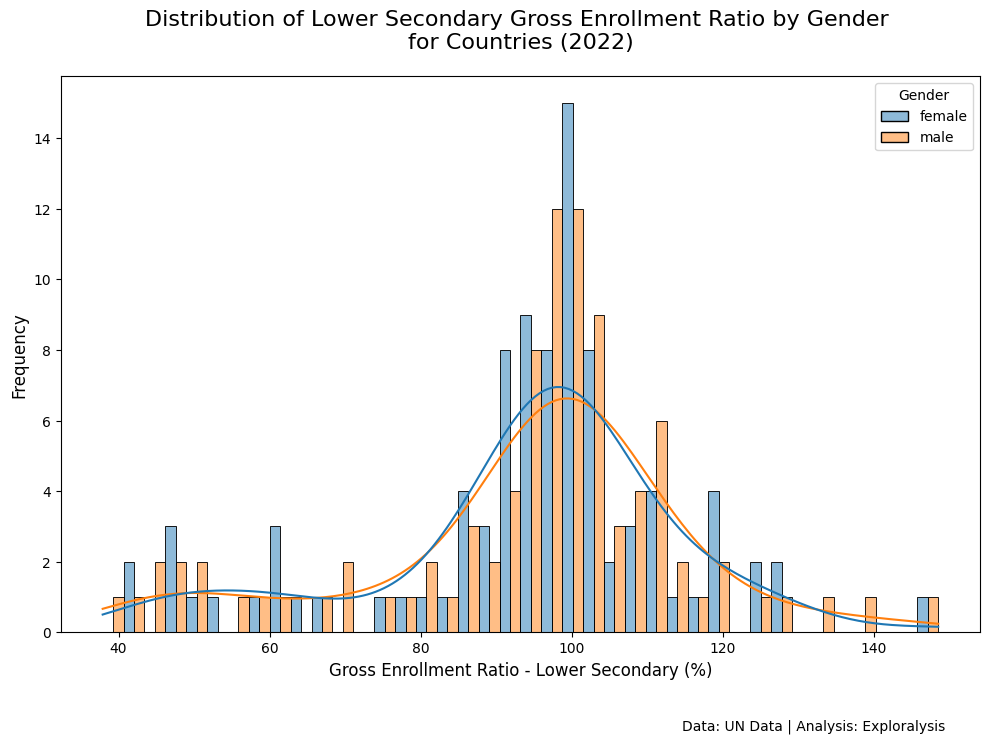
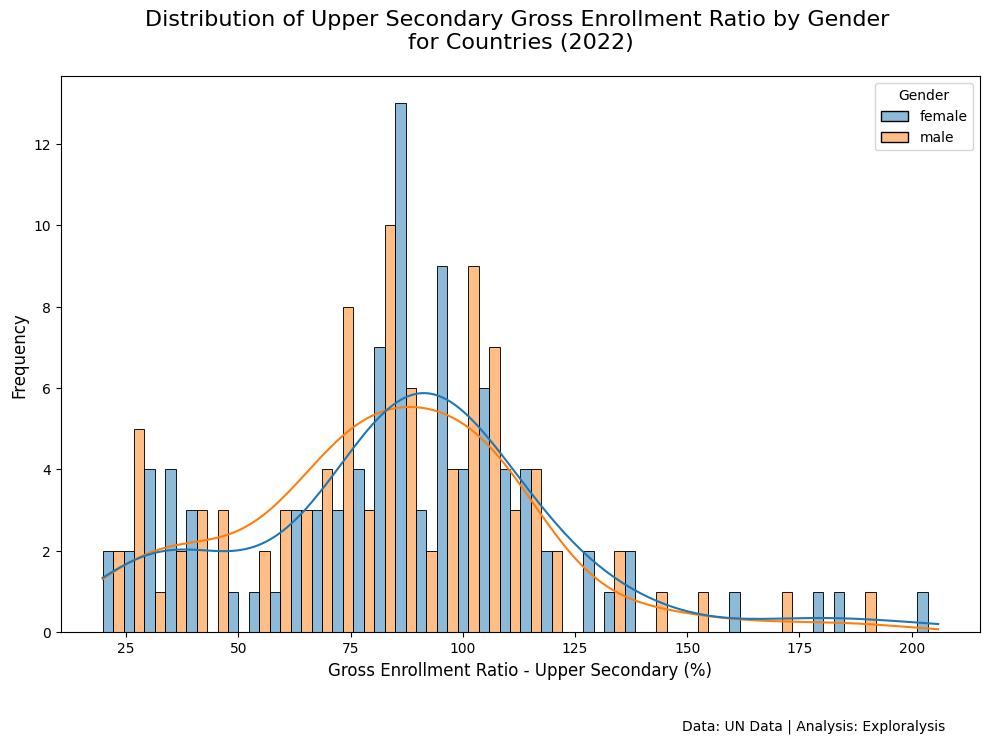
For lower and upper secondary education, GER values are more widely spread.
Multiple peaks in GER distributions suggest distinct clusters of countries, possibly driven by regional, cultural, or economic factors.
These trends imply that while many countries succeed in achieving near-universal primary education, fewer manage similar results in secondary education.
Comparing GER Across Countries
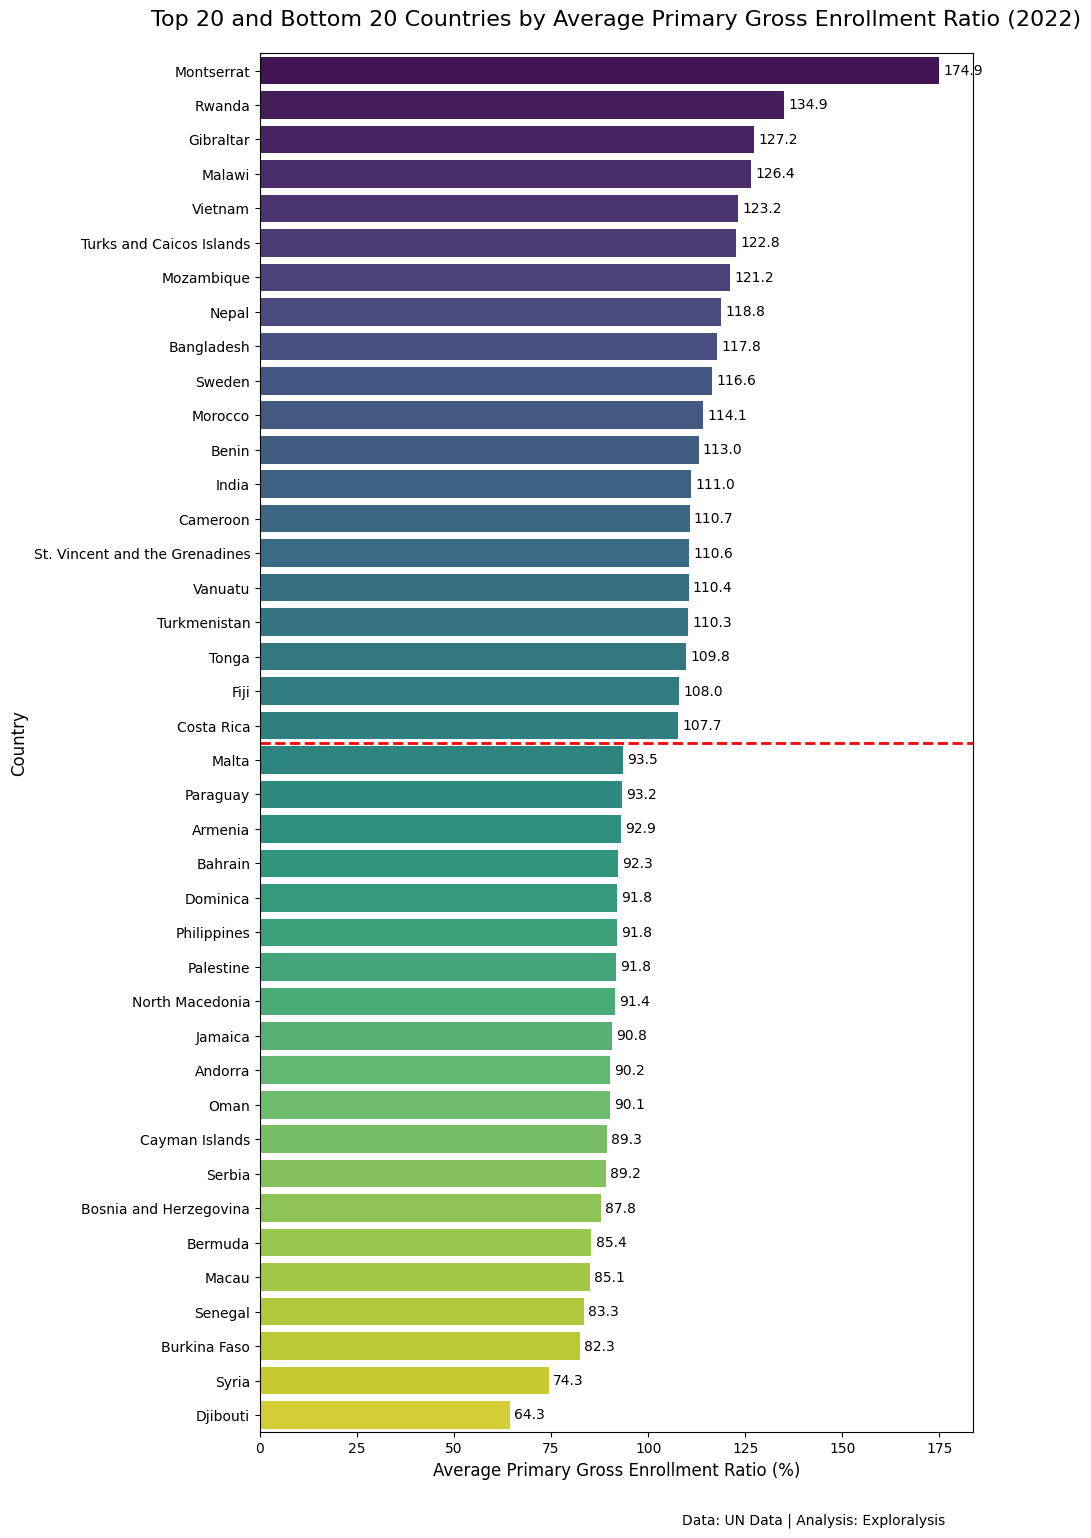
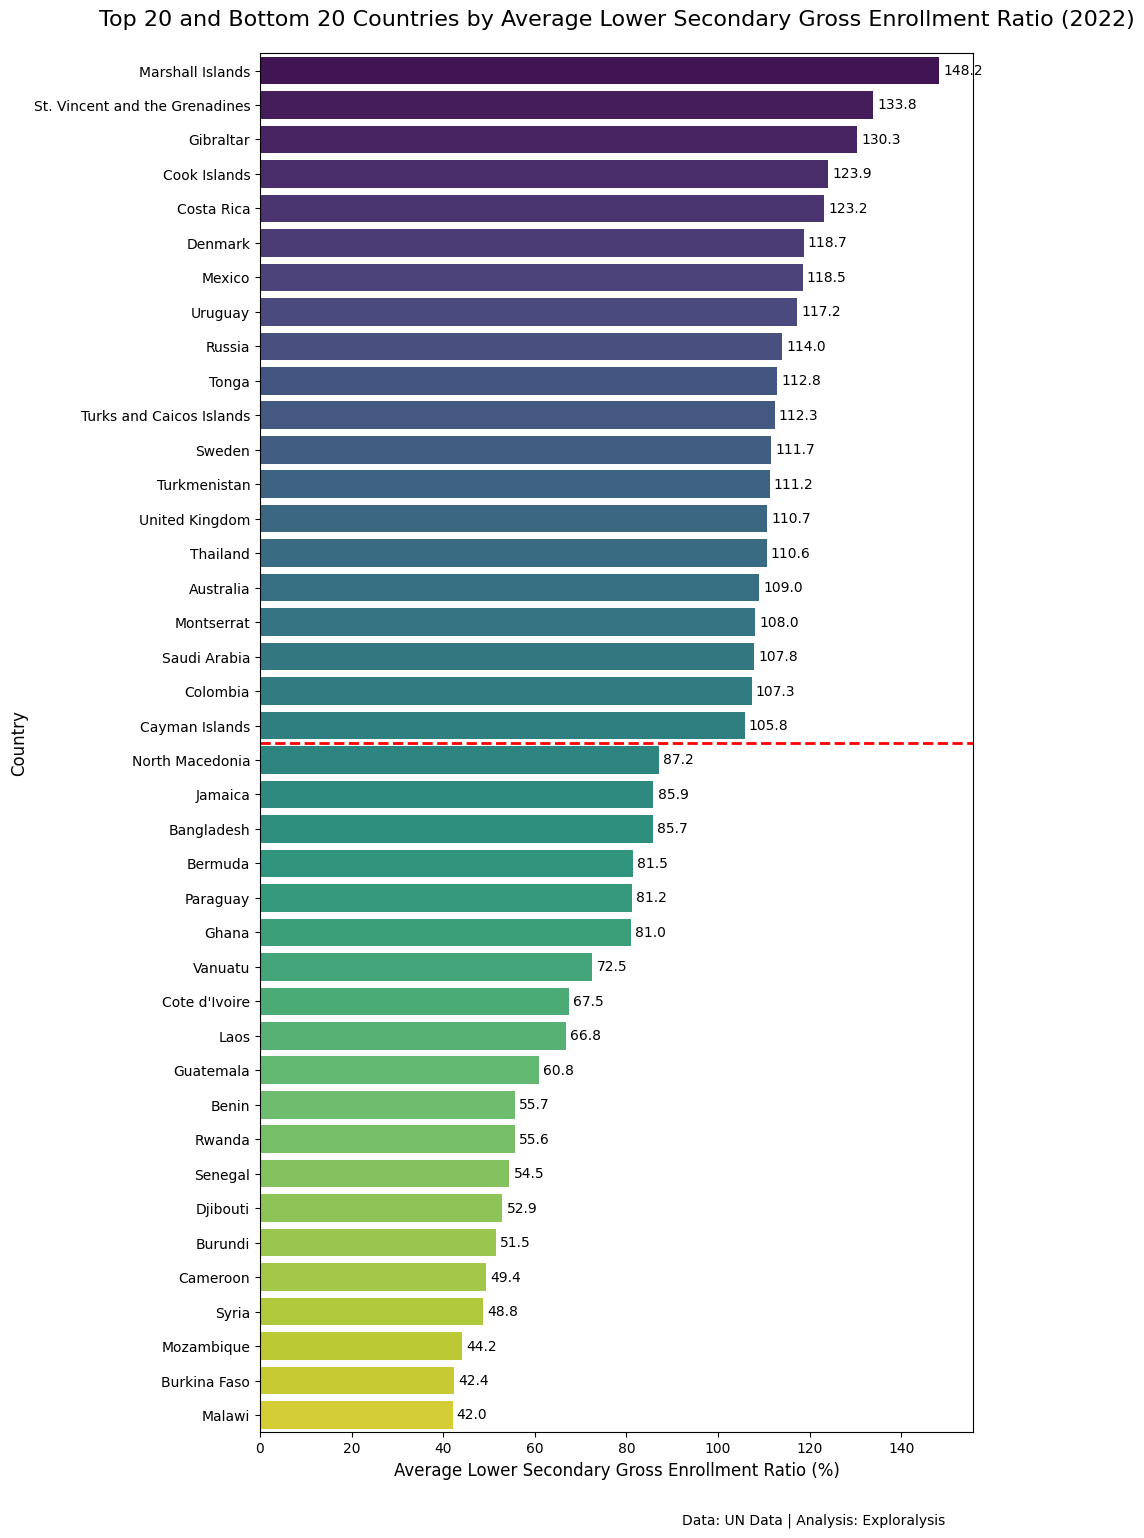
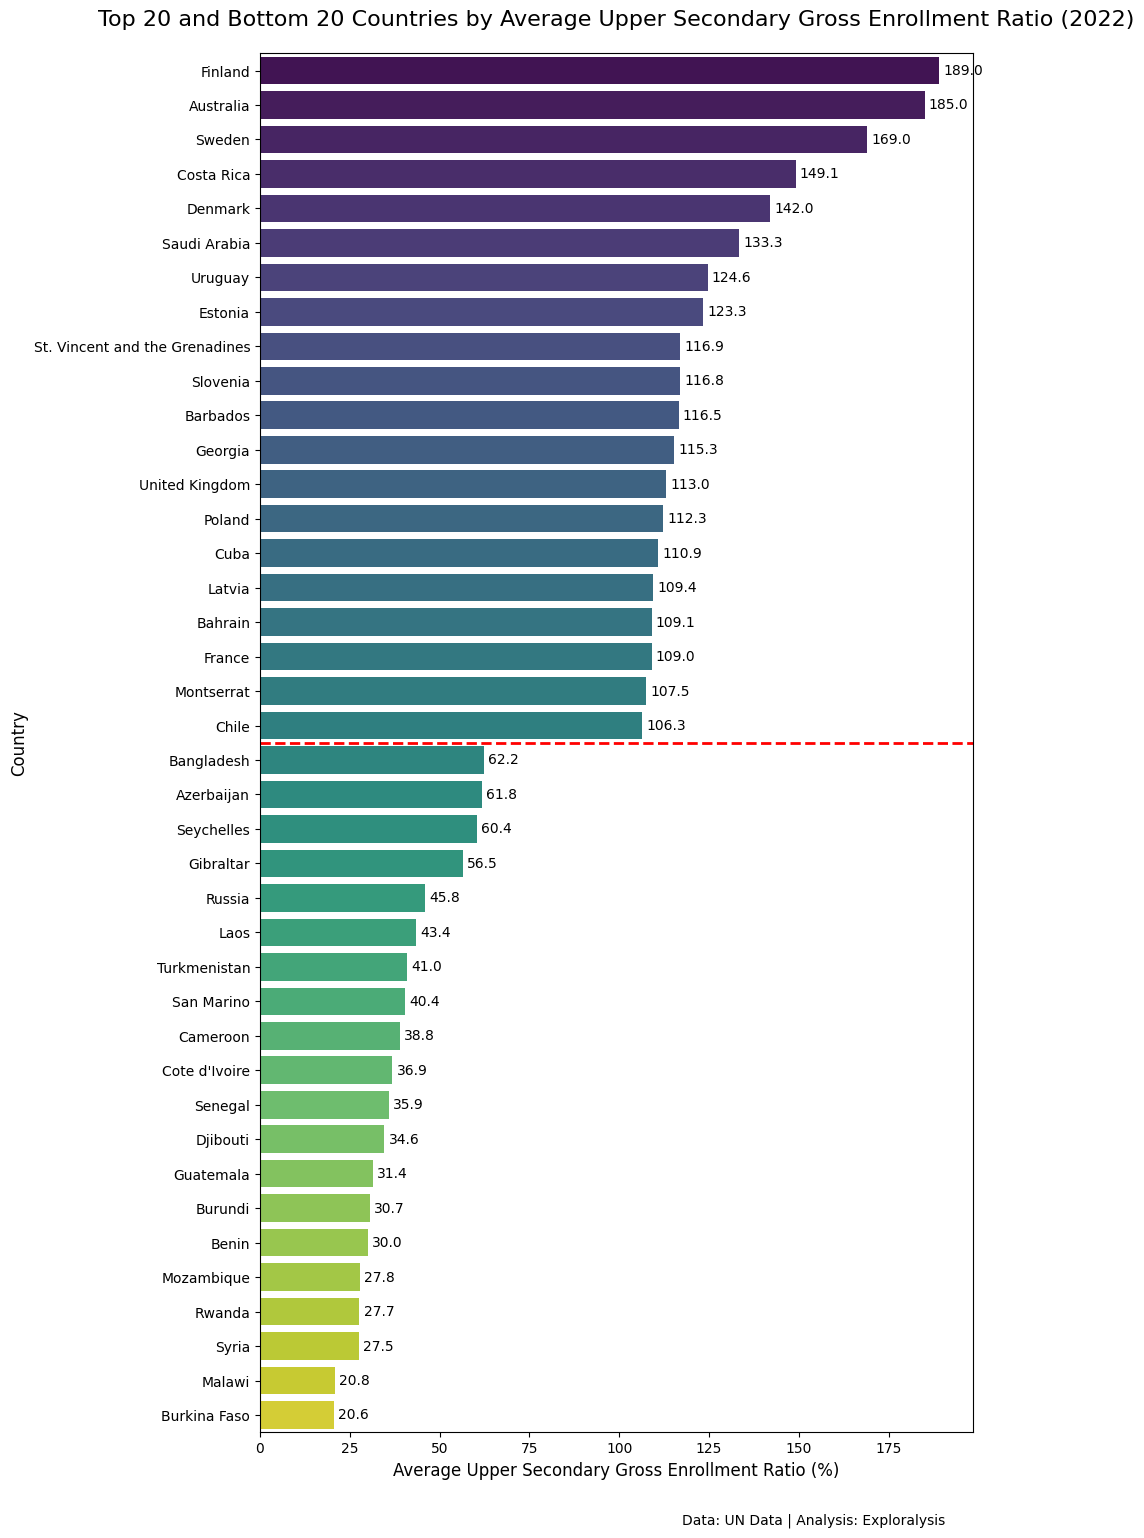
We examined the top and bottom 20 countries based on average GER. However, rankings based on GER alone often reflect the size of a country’s population rather than actual enrollment quality. Therefore, we also focused the analysis on the top 40 most populous countries, which gives a more balanced view.
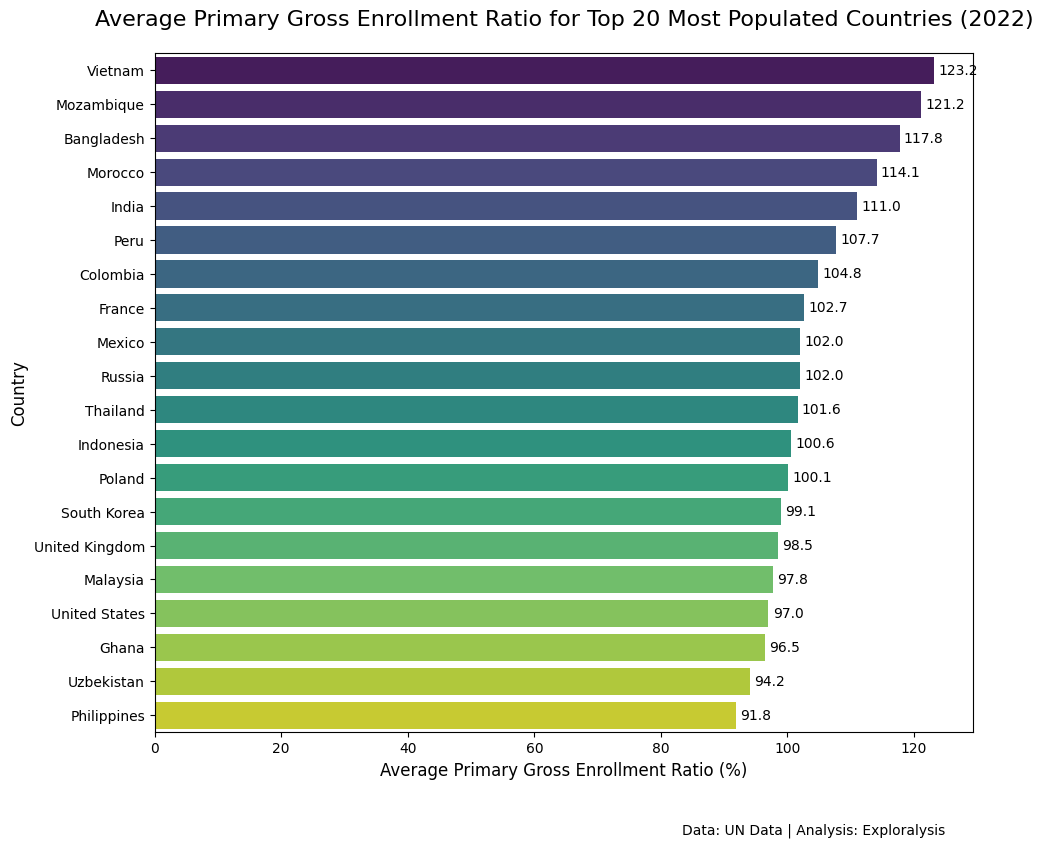
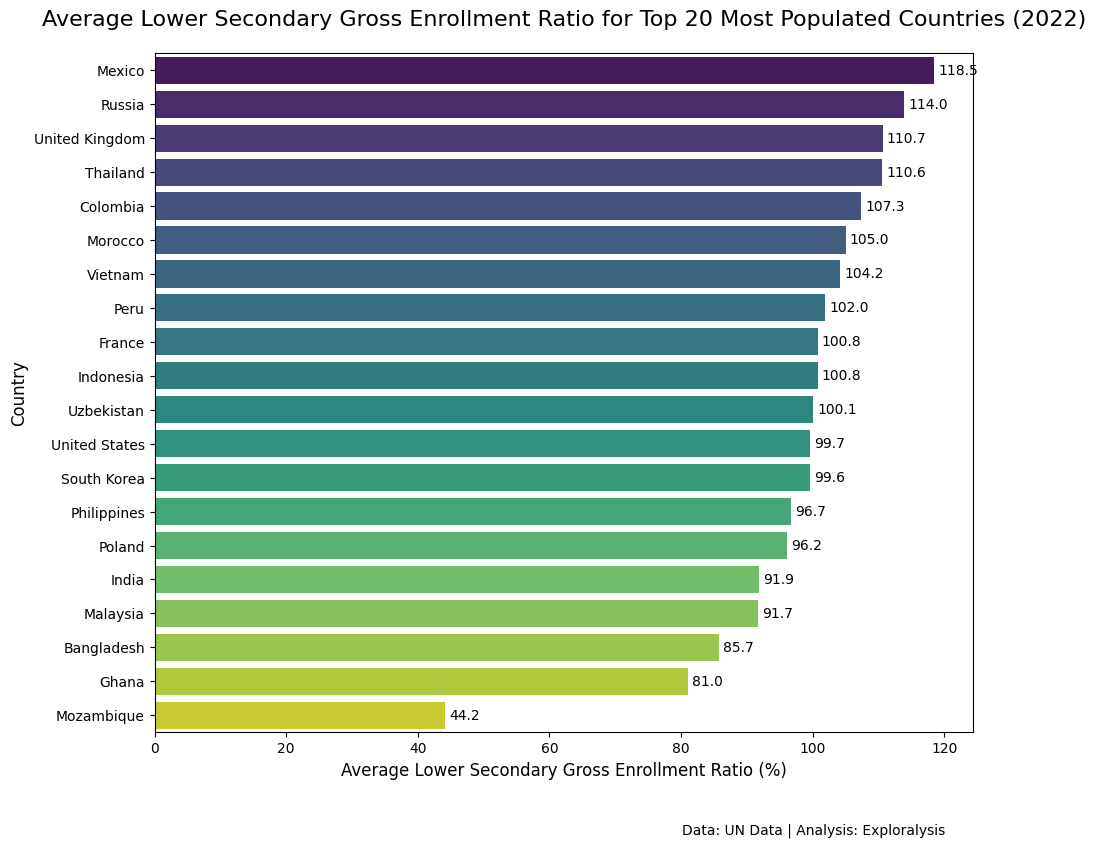
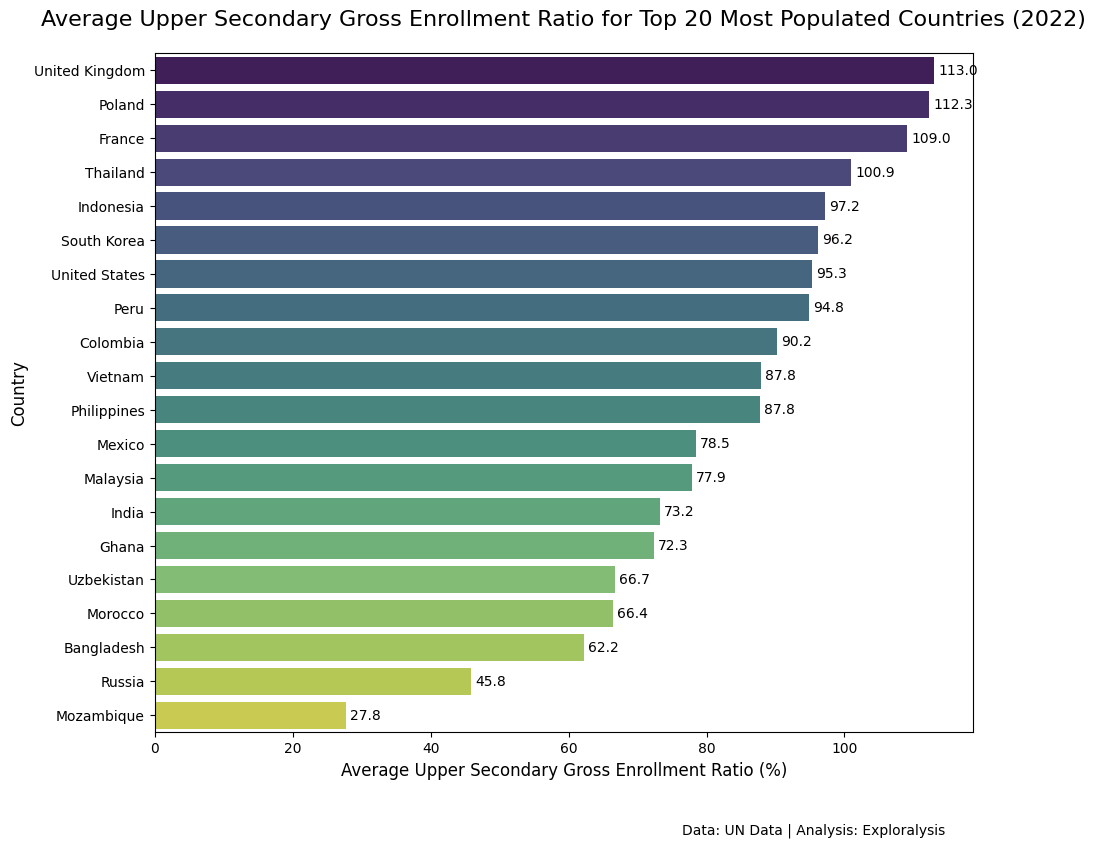
Several patterns emerged when tracking GER across primary, lower secondary, and upper secondary levels:
Countries like India, Mozambique, and Bangladesh show a sharp decline in enrollment after primary school.
Others like Vietnam and Peru exhibit steady declines.
Countries such as the UK, Poland, and South Korea start lower in primary but improve in upper secondary.
Countries like Indonesia and the USA show inconsistent patterns.
Nations such as Malaysia, Ghana, Uzbekistan, and the Philippines tend to stay in lower GER ranks across all levels.
Exploring Relationships with Population and GDP
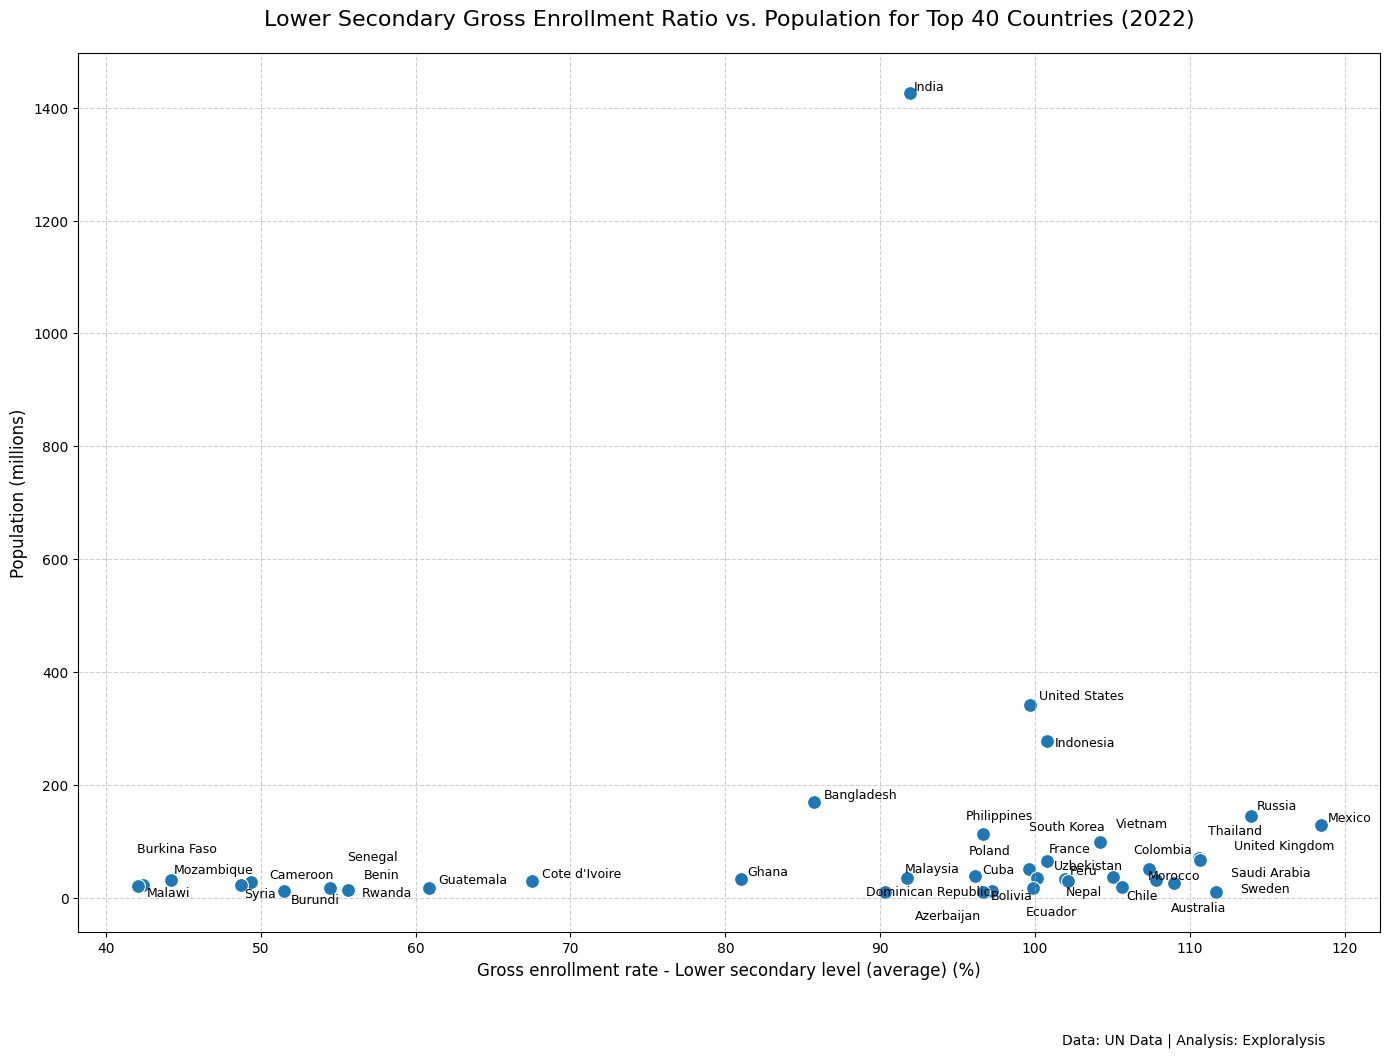
GER vs. Population
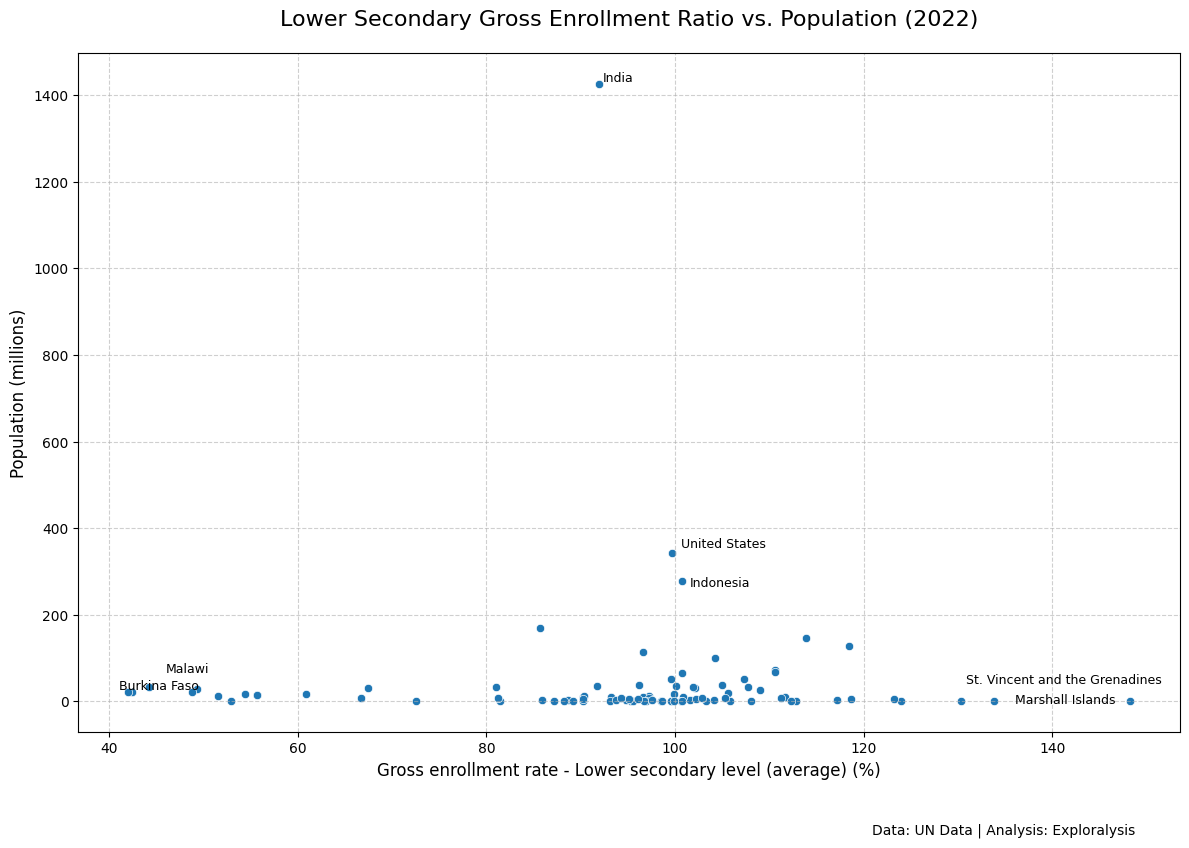
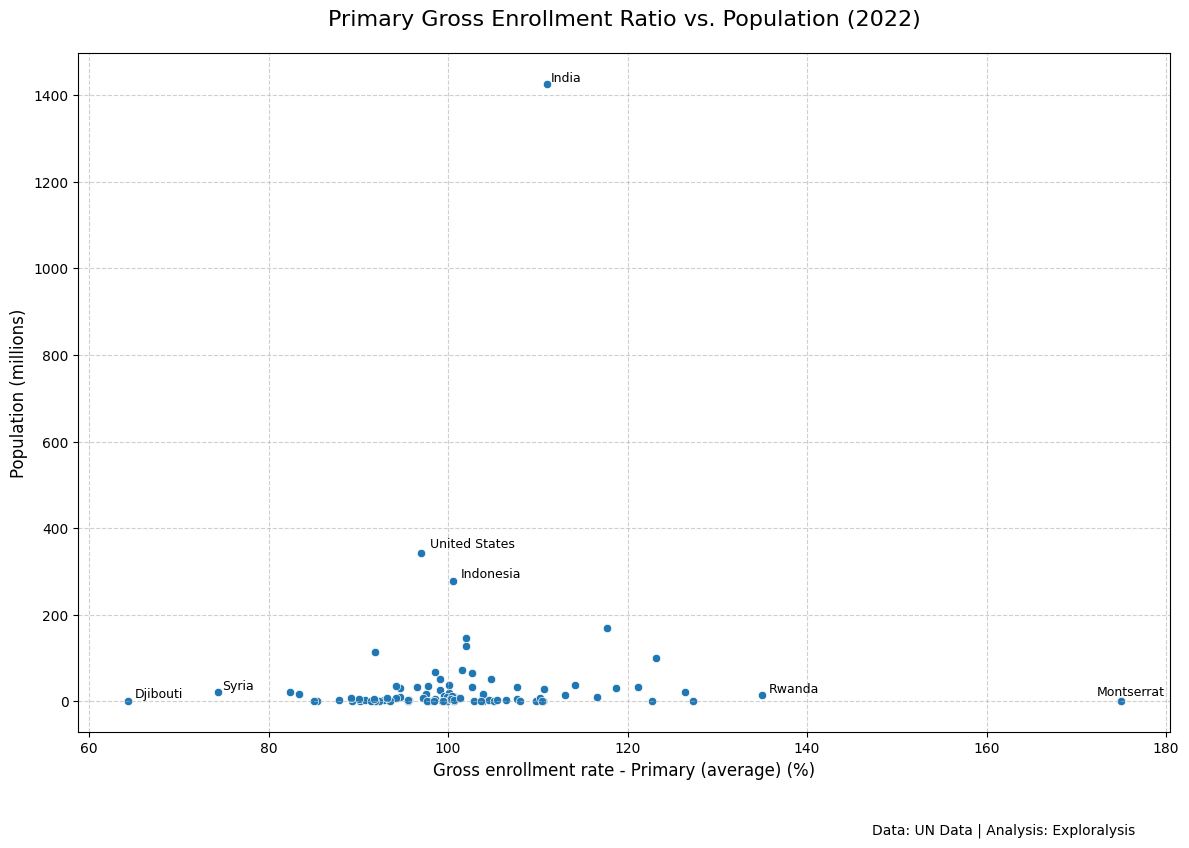
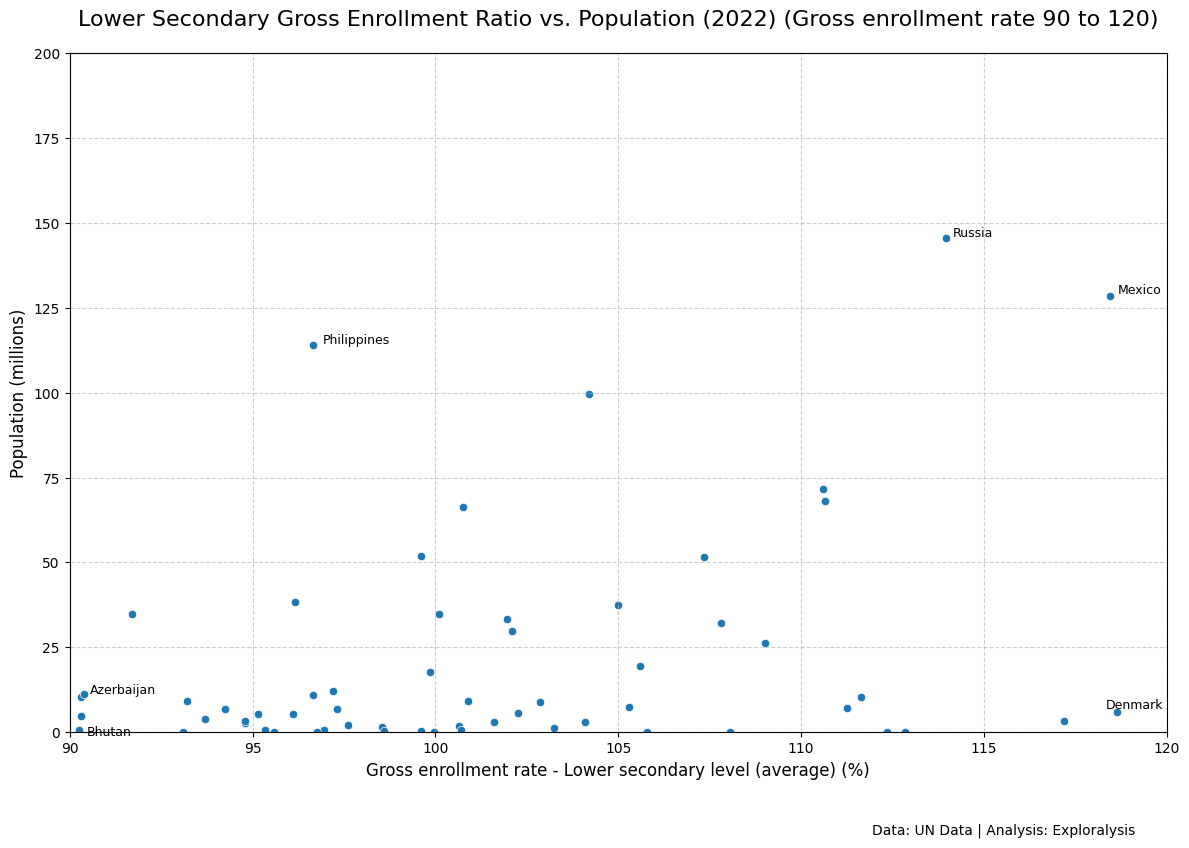
Scatter plots between GER and population reveal little correlation across the full dataset. However, a potential linear pattern emerges within a GER range of 90 to 120, suggesting population may influence enrollment levels within that band.
GER vs. GDP per Capita
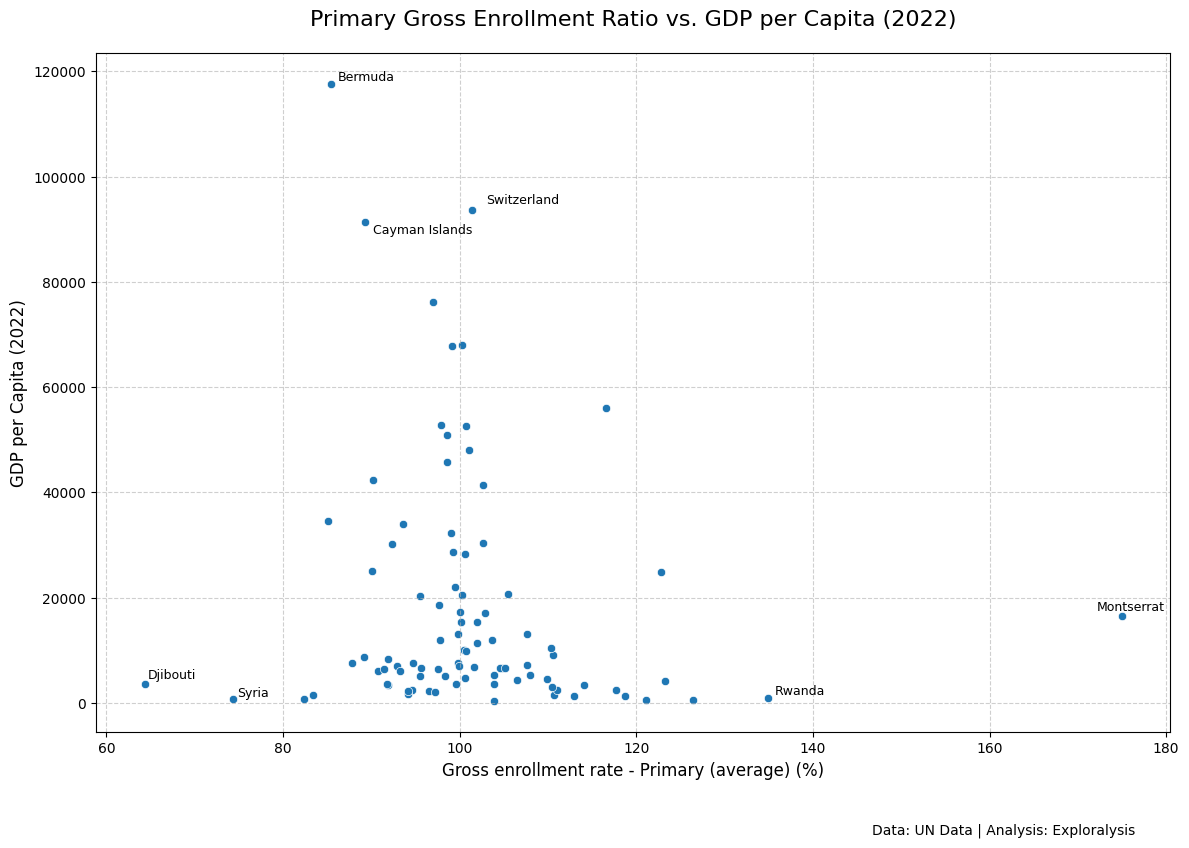
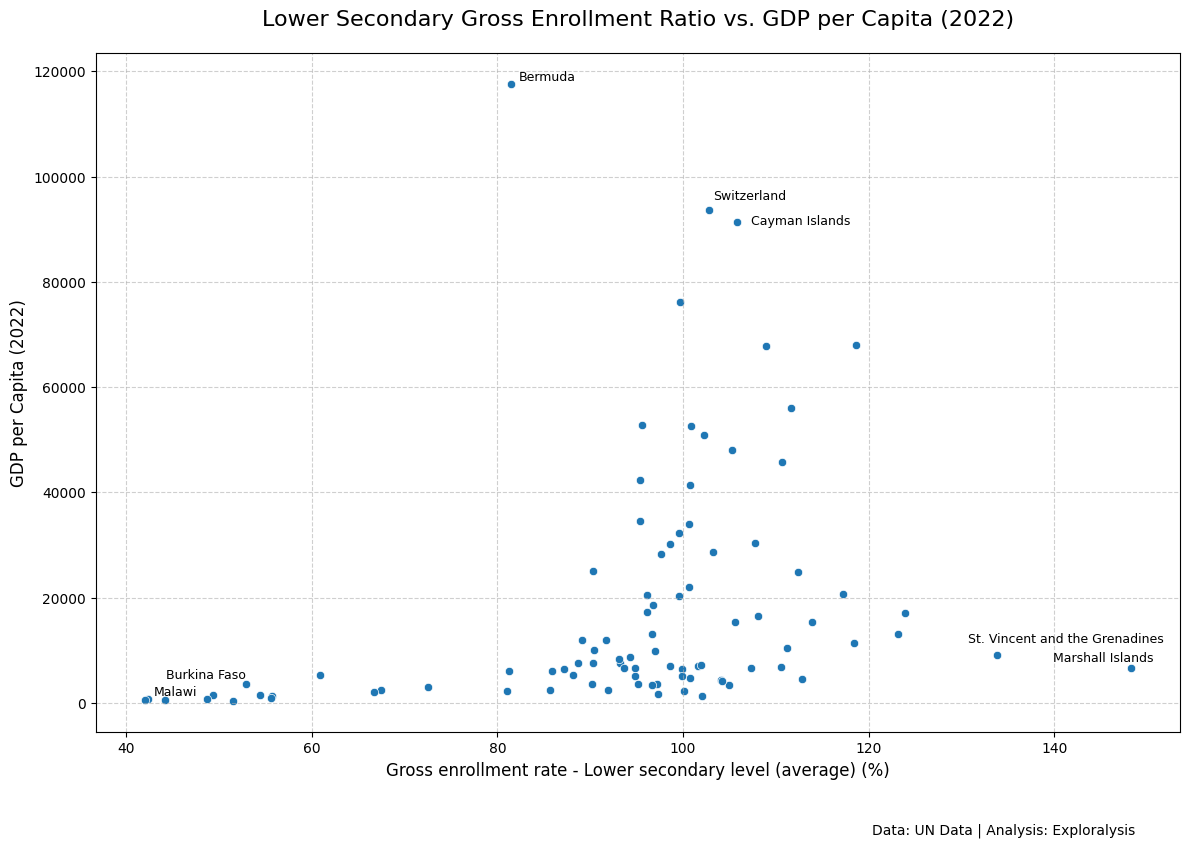
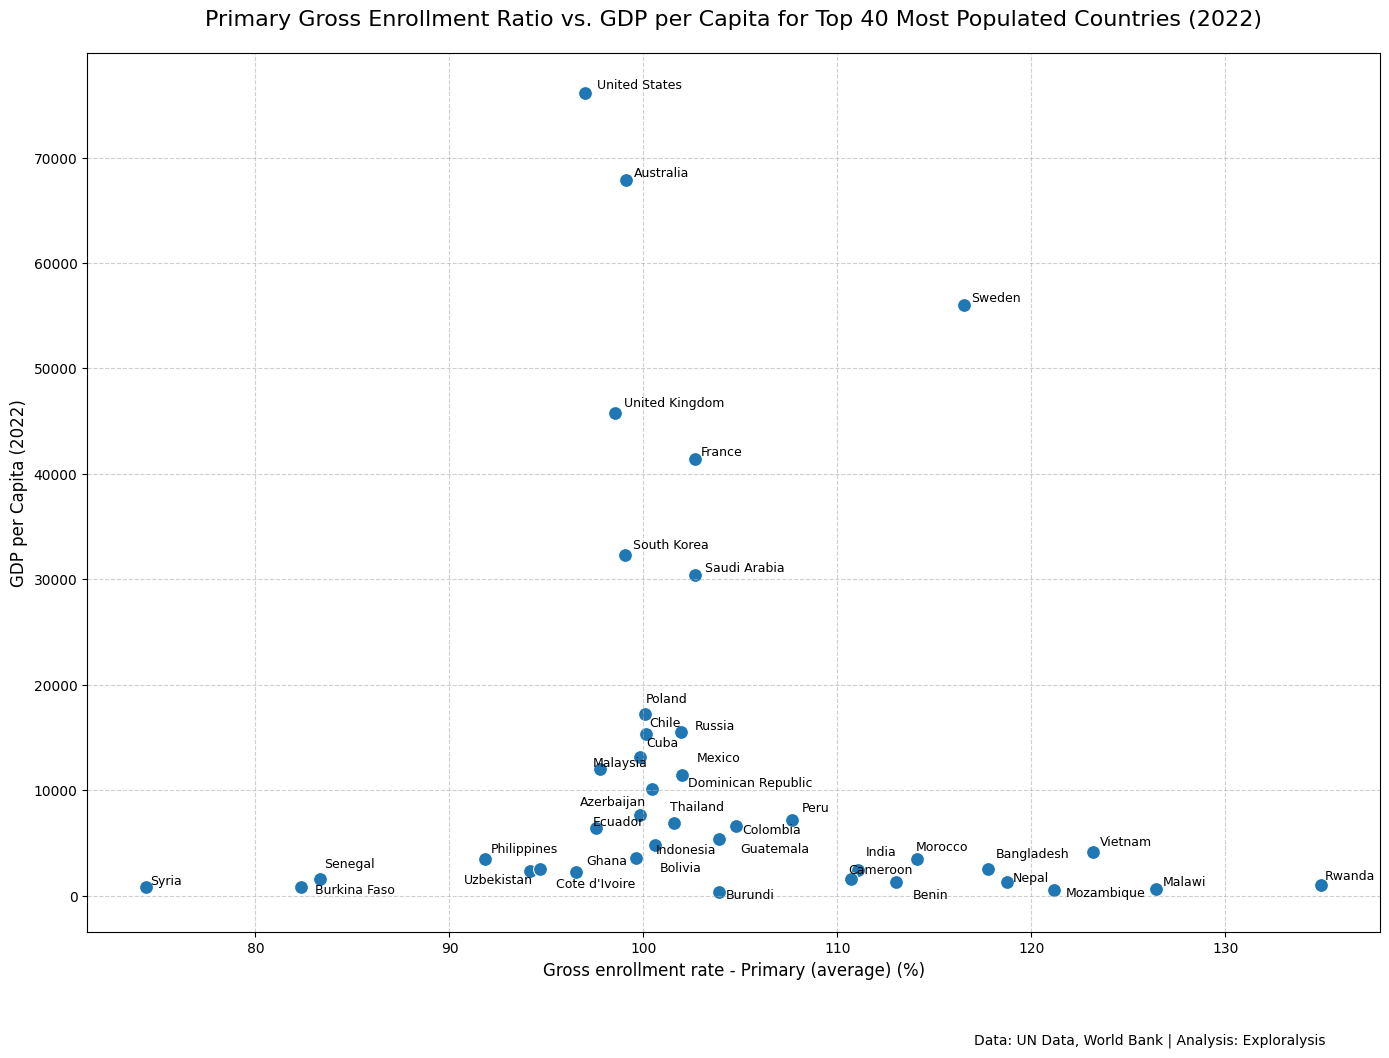
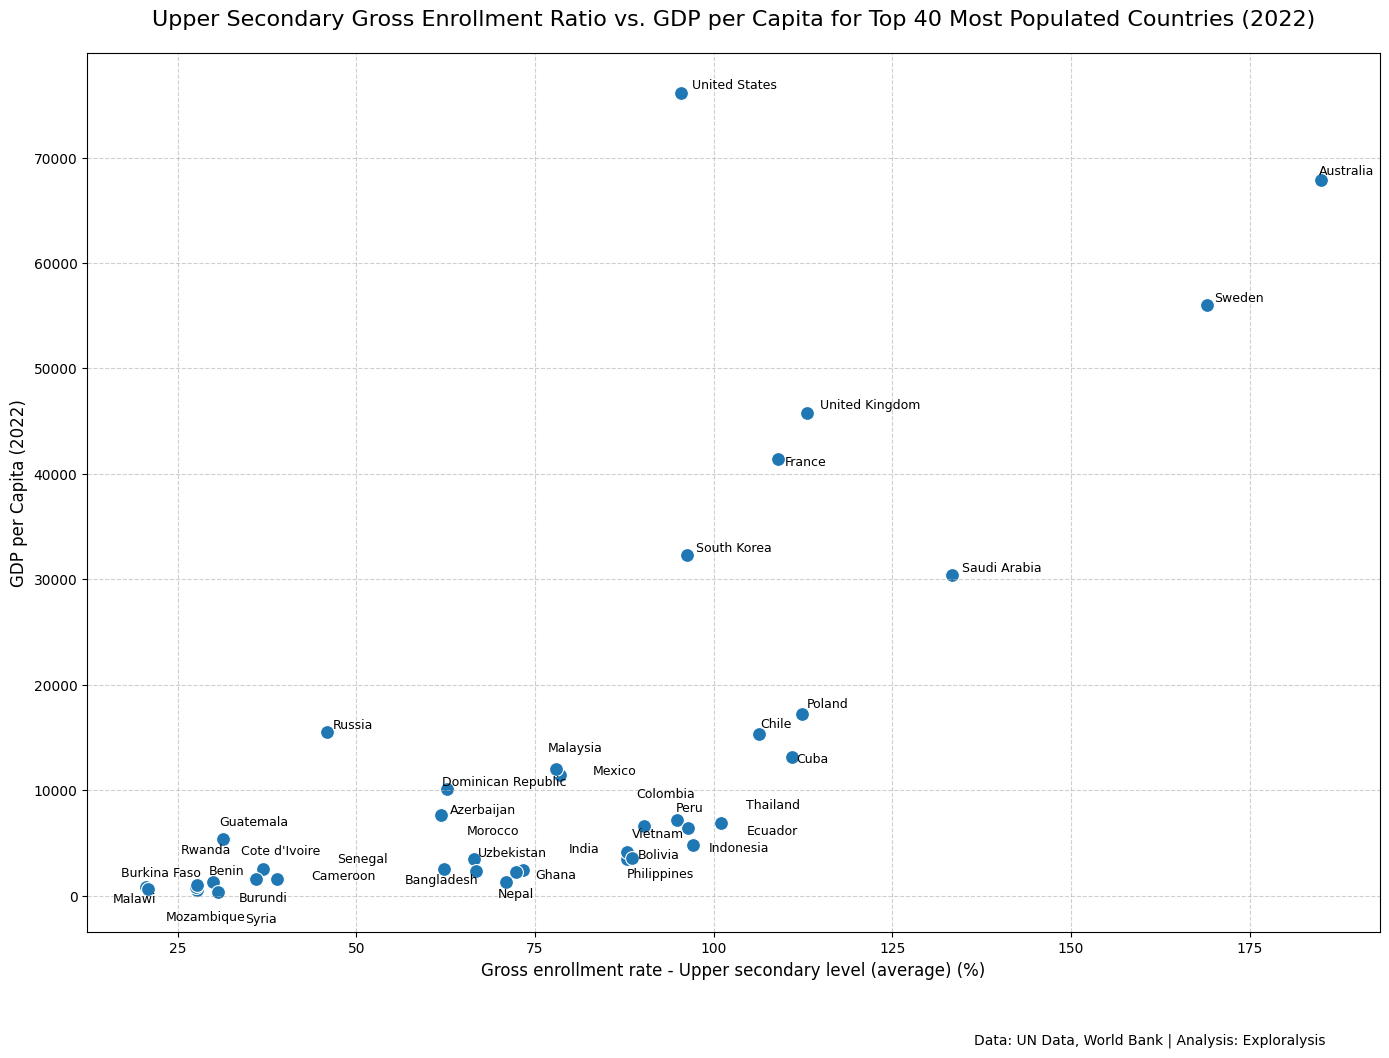
When plotting GER against GDP per capita, the results show more defined patterns:
A positive linear correlation is especially visible in upper secondary GER, indicating that wealthier nations are more likely to achieve higher enrollment in higher education.
The relationship weakens for primary education, where many countries cluster around the 100 percent GER mark.
Diminishing returns appear in some GER vs. GDP charts, especially for primary education, suggesting that after reaching universal access (GER near 100), additional GDP has limited impact on enrollment rates.
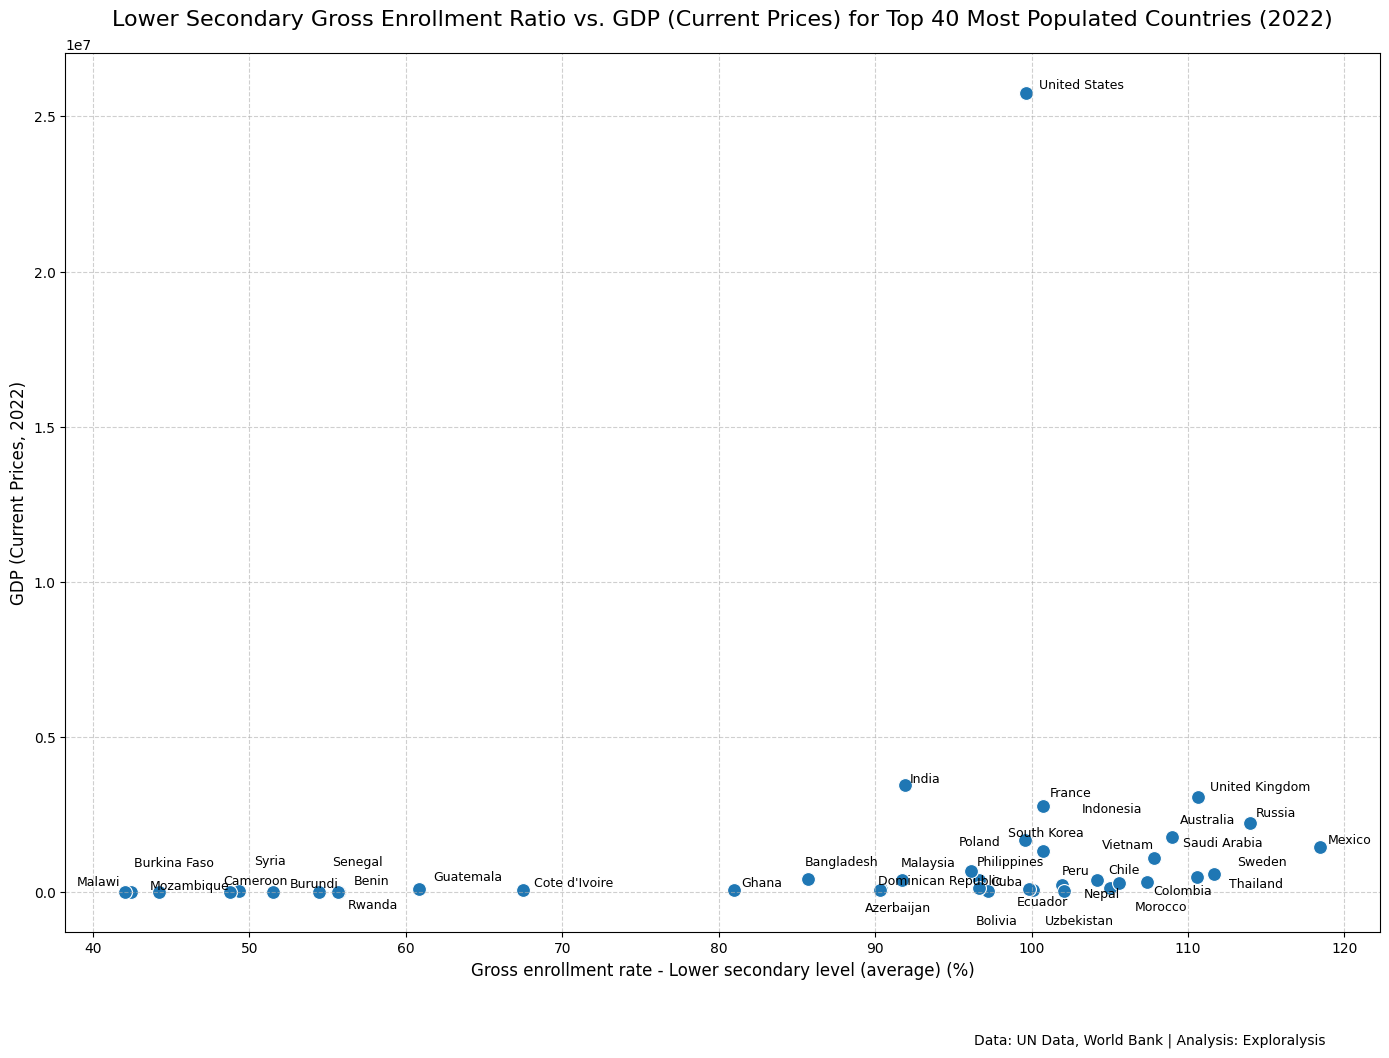
Identifying Outliers
Some outliers affect the clarity of these patterns:
USA stands out for GDP.
India skews population-based charts.
Removing such outliers sharpens the visibility of trends, particularly the linear relationship between GDP per capita and GER above 80 percent.
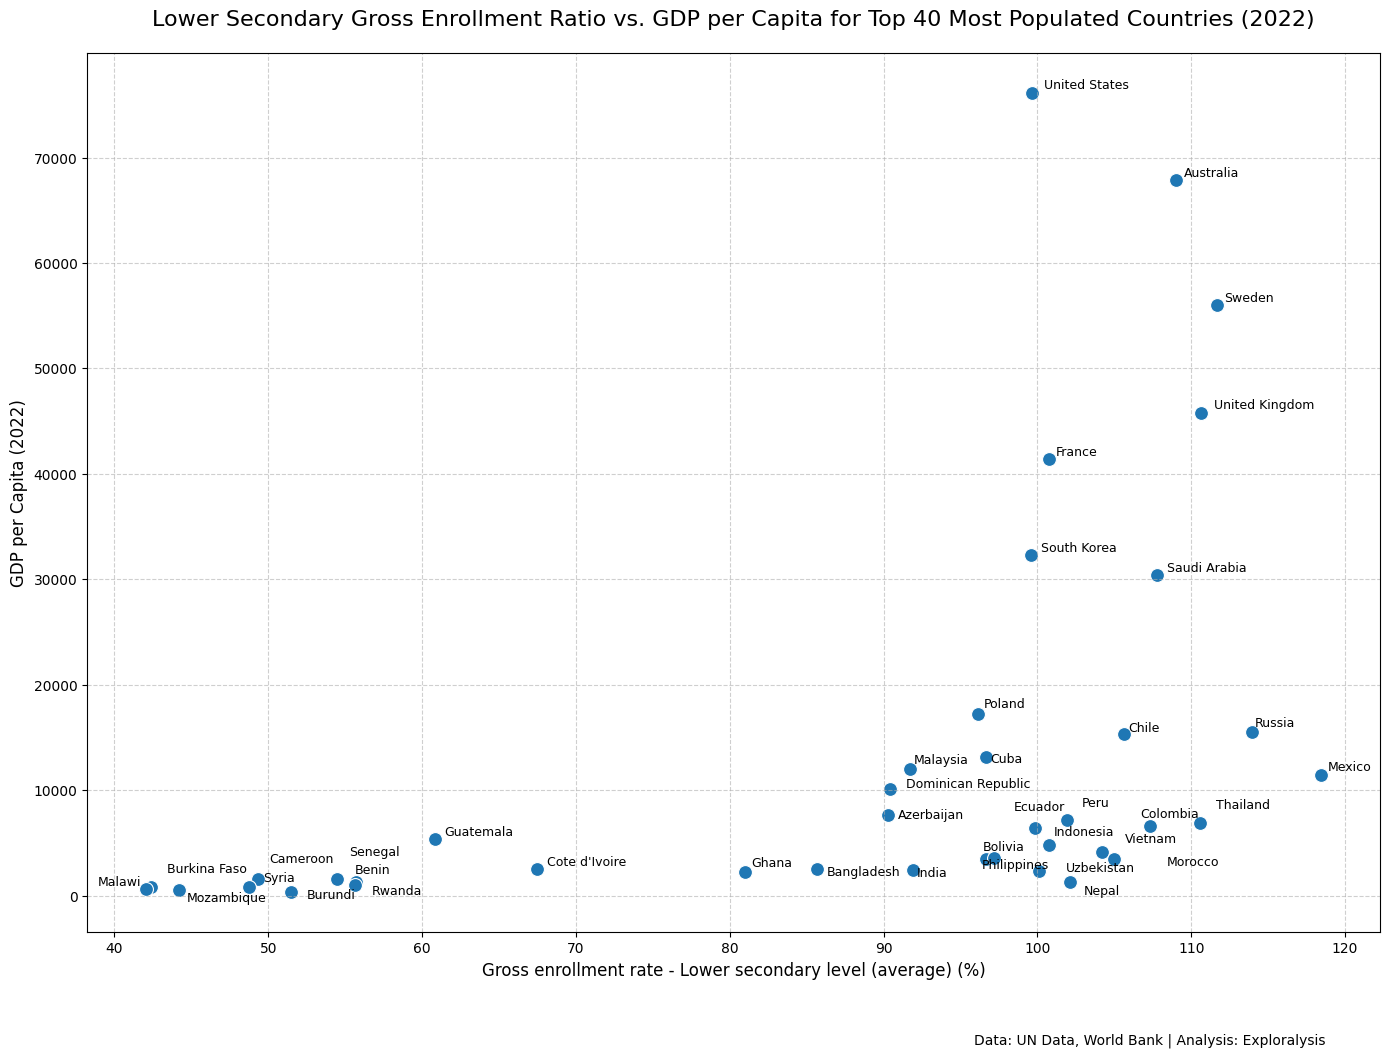
Key Insights on Enrollment Clusters
A clearer pattern emerges when narrowing the analysis to the 40 most populous countries:
Countries with lower secondary GER between 40 and 70 form a distinct cluster, indicating systemic challenges in secondary education access.
The GER vs. GDP per capita scatterplots for upper secondary education reveal a strong linear correlation, with most data points falling below the 100 GER mark. This suggests fewer countries prioritize or reach universal access at this level.
Education and Gender Parity
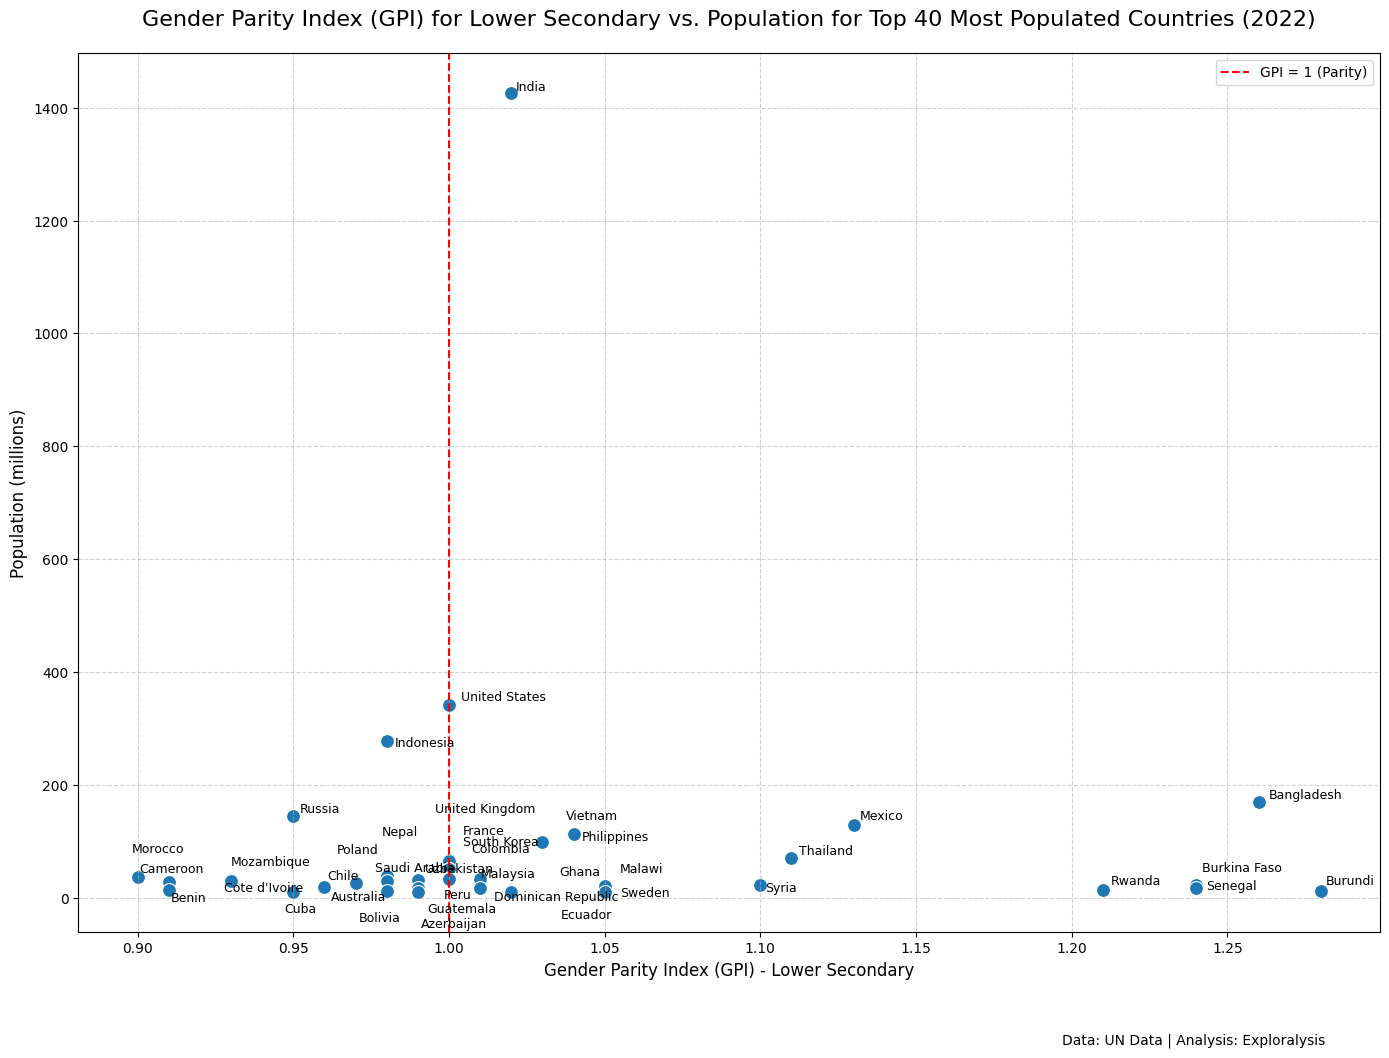
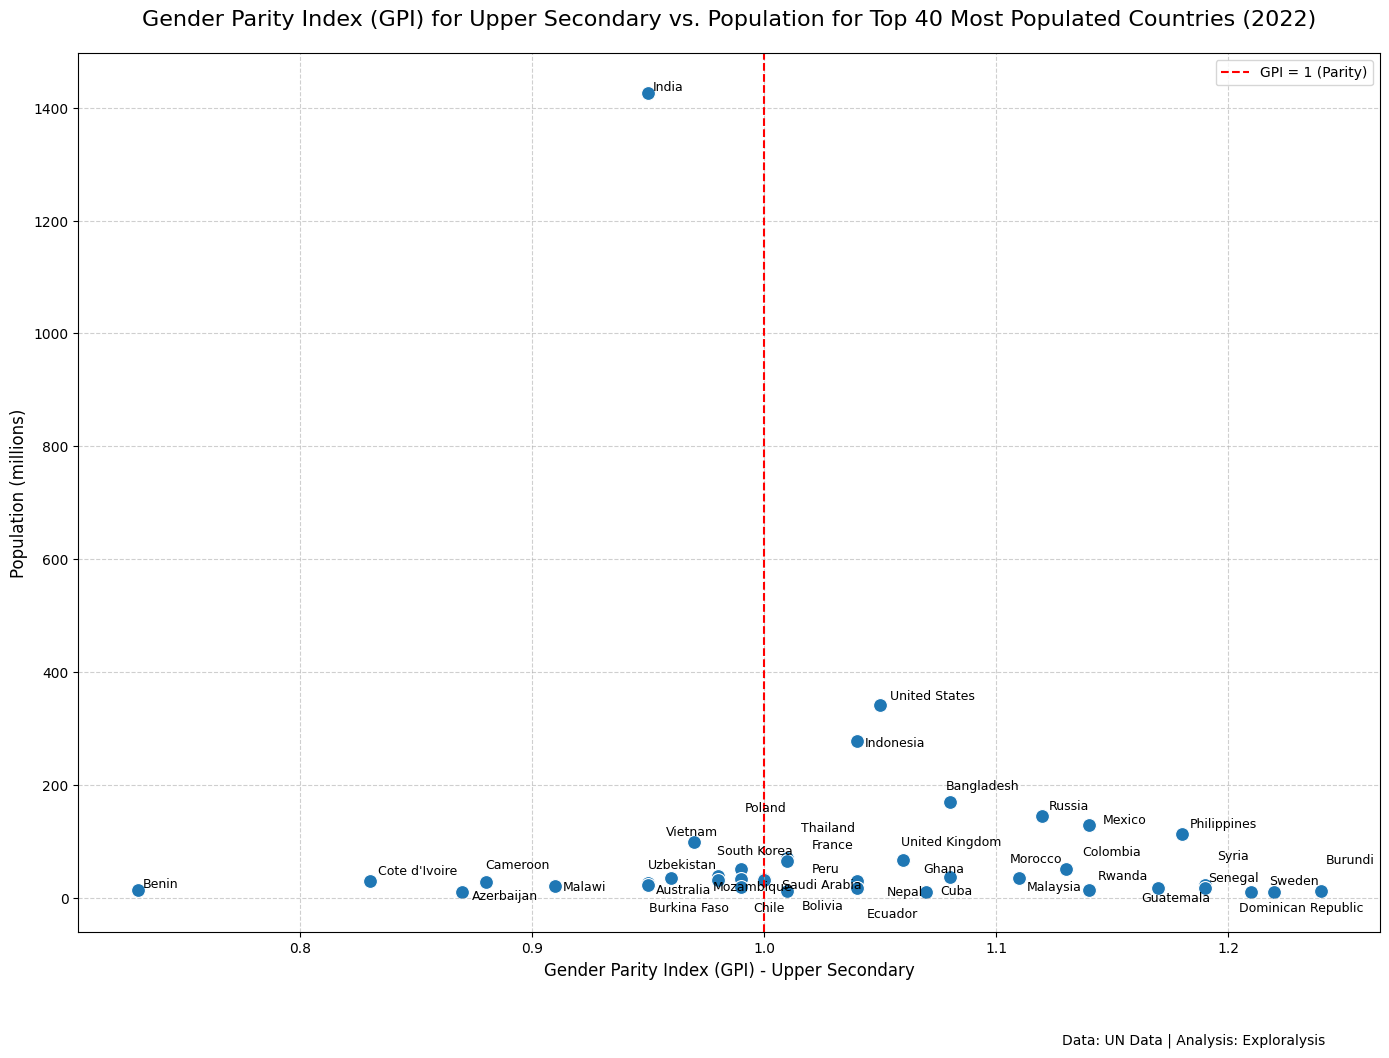
Analysis of the Gender Parity Index (GPI) shows:
A weak but positive correlation between population size and GPI, especially for secondary education. As population increases, so does the slight advantage in enrollment for females.
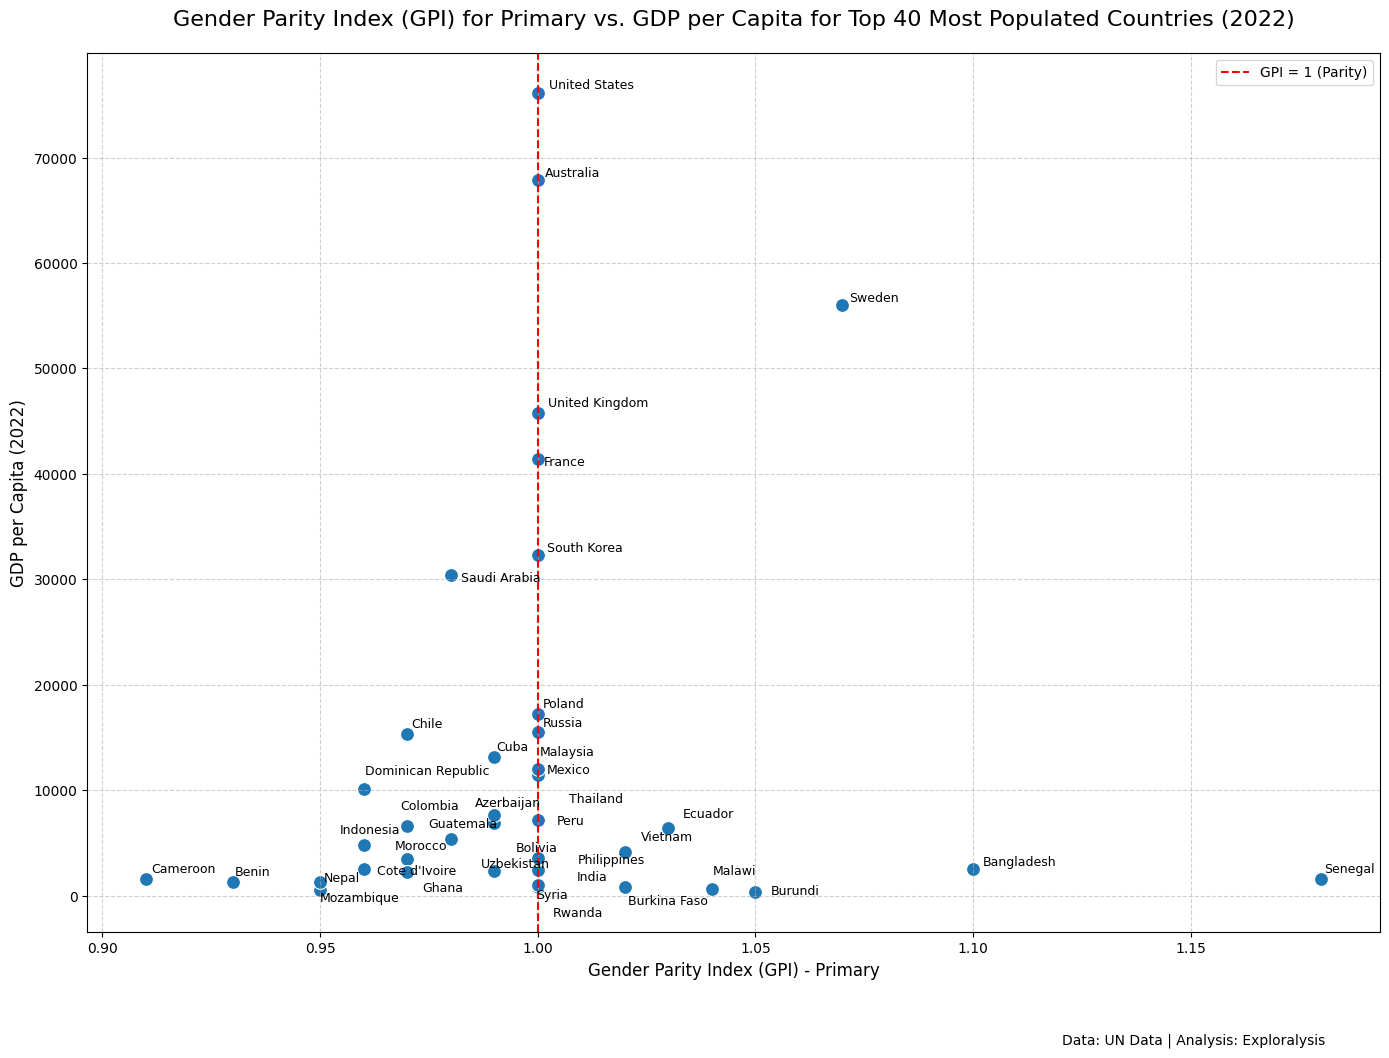
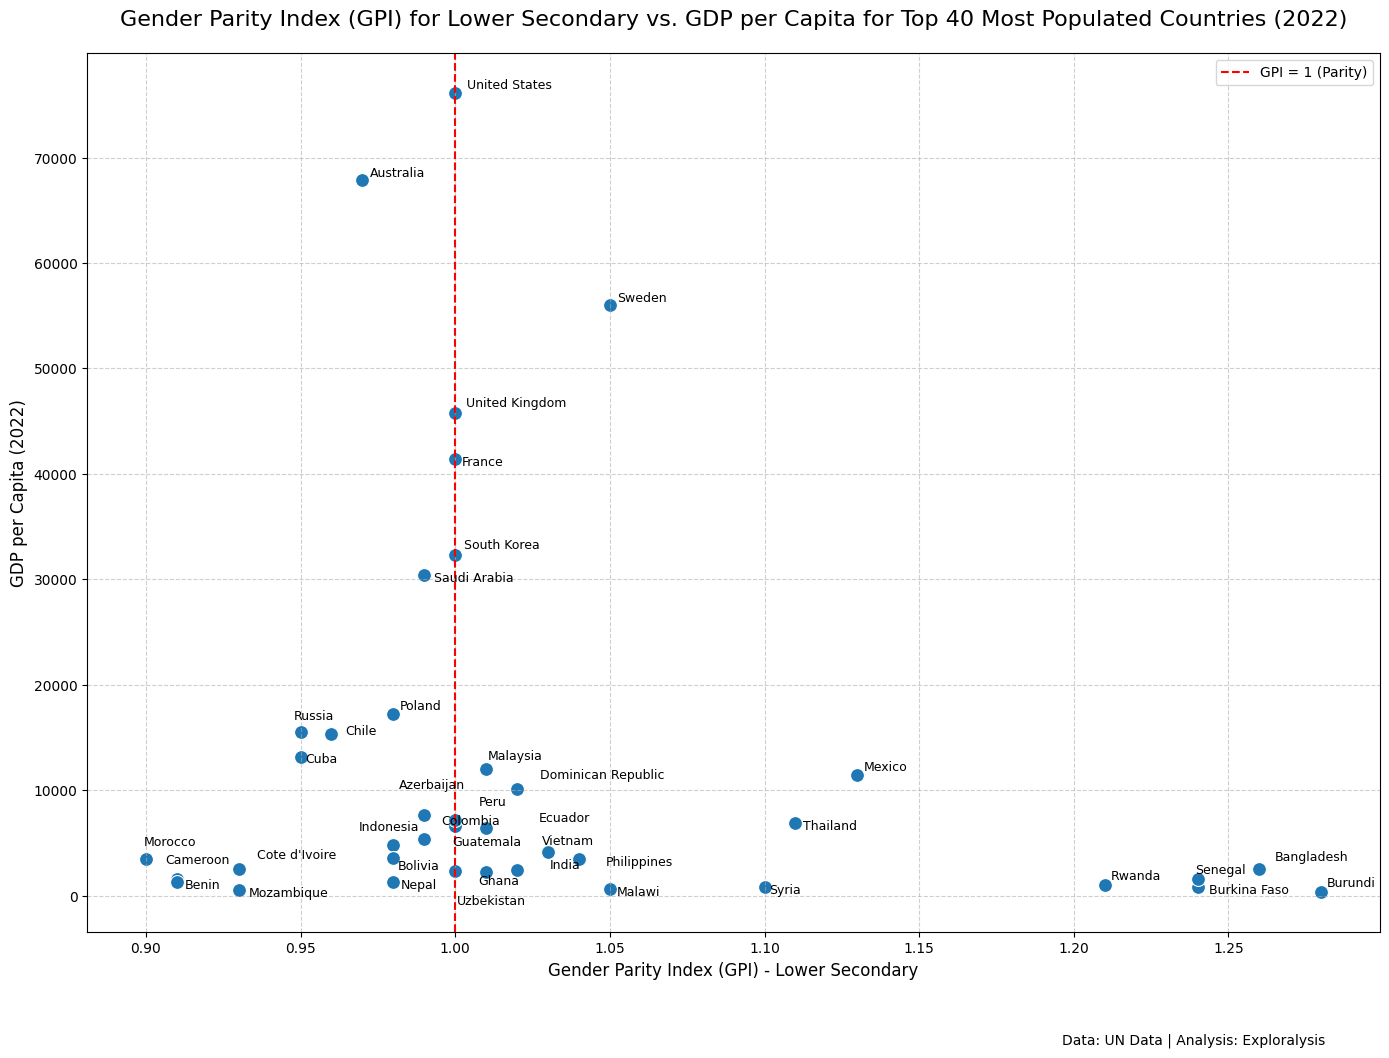
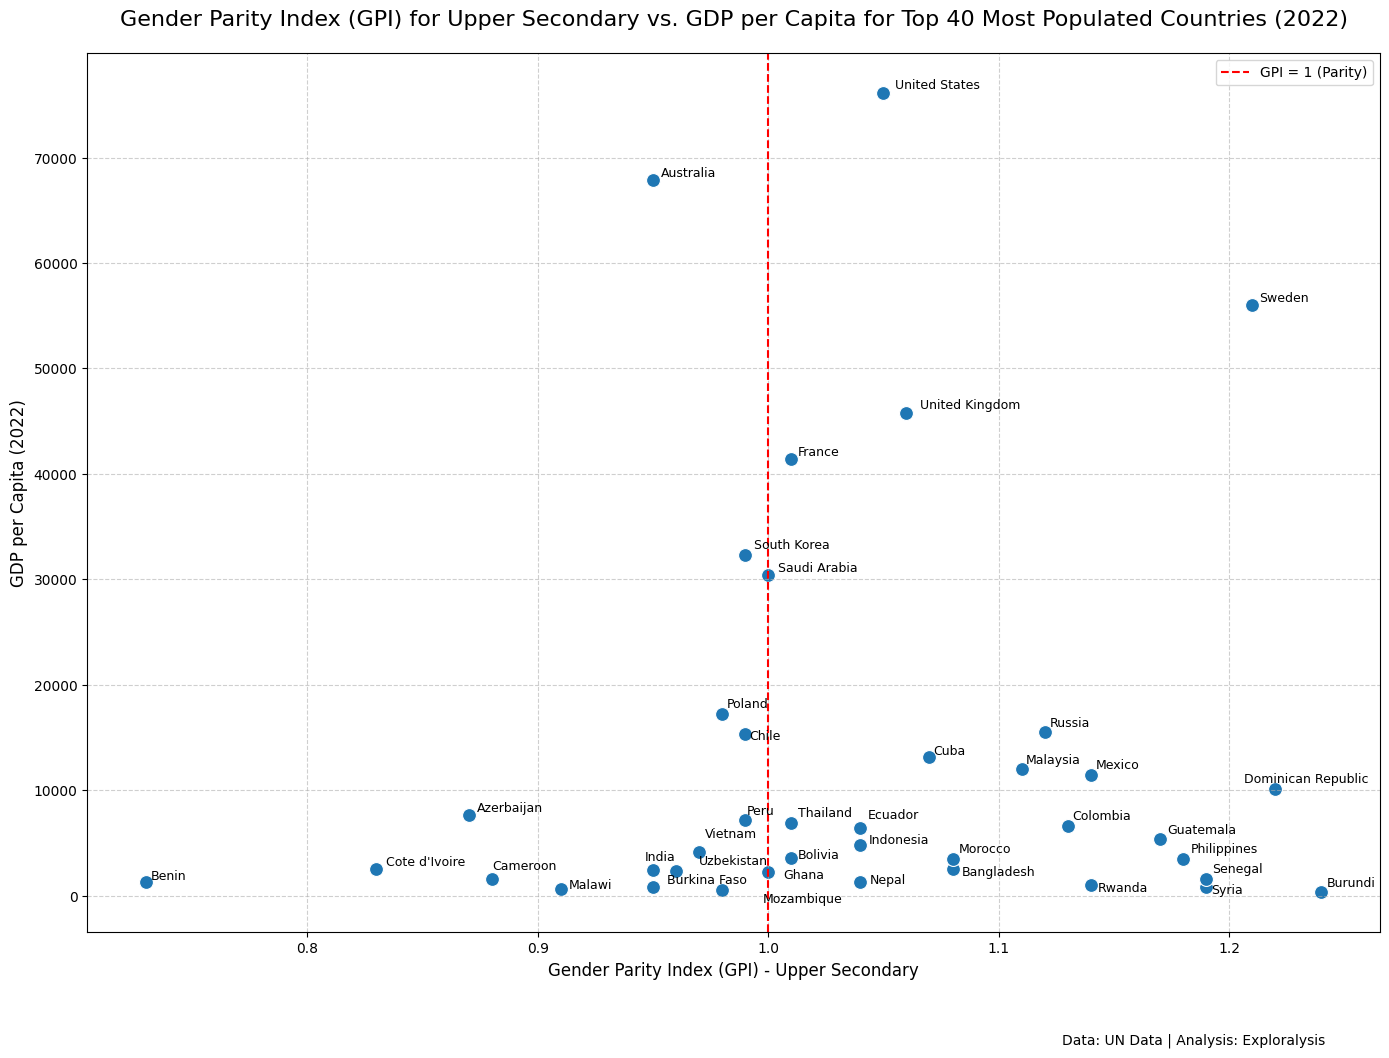
Among the 40 most populous countries, GDP per capita is most strongly correlated with GPI for upper secondary education. This suggests that higher-income countries are more successful in achieving female-favorable or balanced enrollment at higher education levels.
In contrast, primary education often shows a slight male advantage, while lower and upper secondary levels tend to favor females.
Final Observations
The gross enrollment ratio is an effective tool for understanding global education access trends.
Primary education is widely accessible, but secondary education remains inconsistent across nations.
Economic development, as measured by GDP per capita, has a strong influence on enrollment in upper secondary education.
Gender parity improves with educational level and country income.
This analysis emphasizes the importance of continued investment in secondary education, particularly in lower-income and high-population countries, to ensure equitable and sustained access to education for all.
Cover photo by CDC.
( Nugroho Budianggoro )