Global Migration and Refugee Trends: Key Data and Insights
This analysis on global migration and refugee trends is based on official data from the United Nations. You can access the dataset at the United Nations Data (UN Data). The dataset provides comprehensive information on international migrants and refugees across all countries, continents, and regions for the years 2005, 2010, 2015, and 2020. It includes the following data columns:
- International migrant stock (both sexes, number)
- International migrant stock (both sexes, % of total population)
- International migrant stock (male, % of total population)
- International migrant stock (female, % of total population)
- Total refugees and people in refugee-like situations (number)
- Asylum seekers, including pending cases (number)
- Other persons of concern to UNHCR (number)
- Total population of concern to UNHCR (number)
This dataset supports in-depth analysis of migration patterns, gender distribution, and the impact of displacement and conflict over time.
What Are International Migrants?
International migrants are individuals who permanently move to a country other than their country of origin. These movements can occur for various reasons, including—but not limited to—armed conflict, economic opportunities, or family reunification.
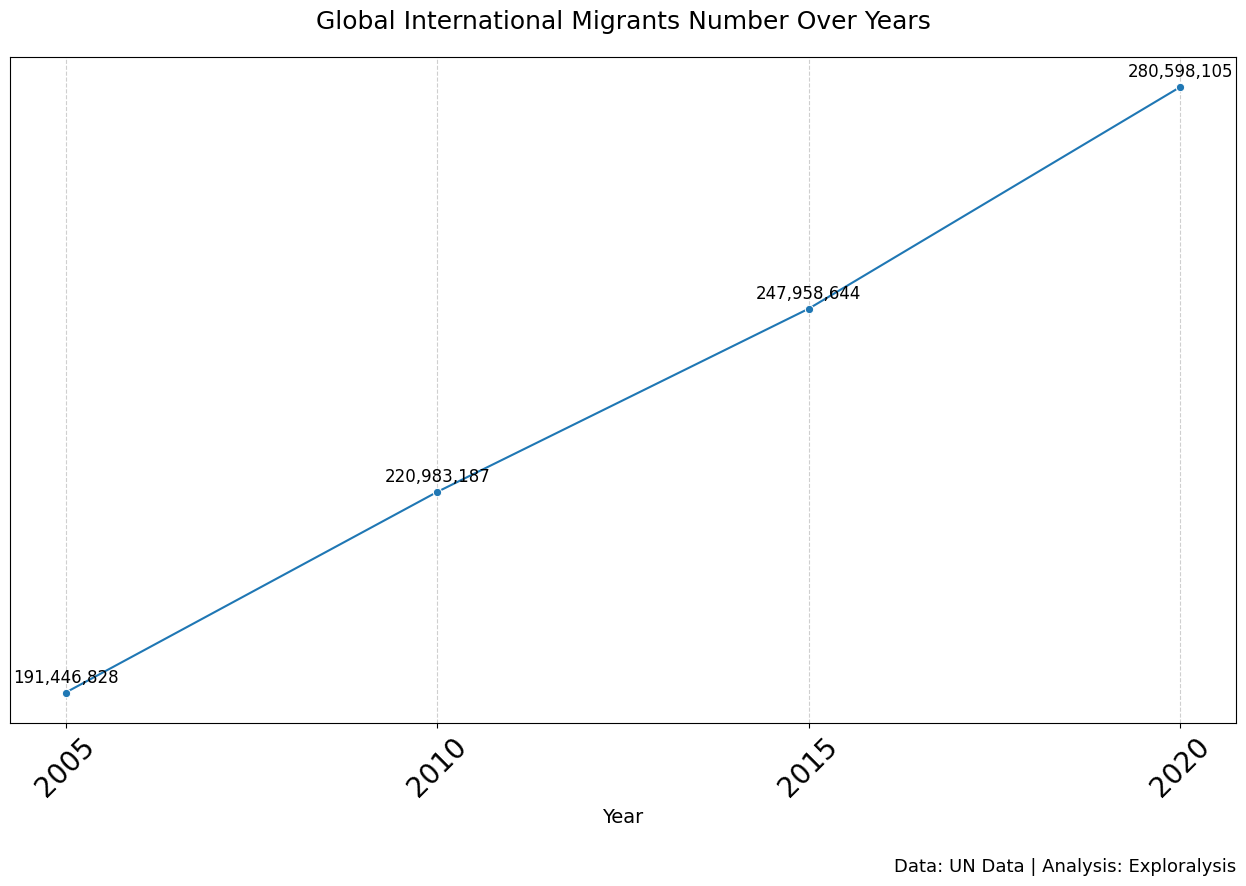
Global Growth of International Migrants (2005–2020)
Between 2005 and 2020, the number of international migrants worldwide grew from 191 million to over 280 million, an increase of approximately 89 million people or 46.57%. This rise suggests a significant and steady global migration trend, nearly doubling in just 15 years.
The growth followed a generally linear pattern, with a slightly slower rate between 2015 and 2020. Interestingly, this increase does not seem to parallel global population growth, suggesting that factors like cheaper travel, easier migration processes, and ongoing conflicts could be driving this trend.
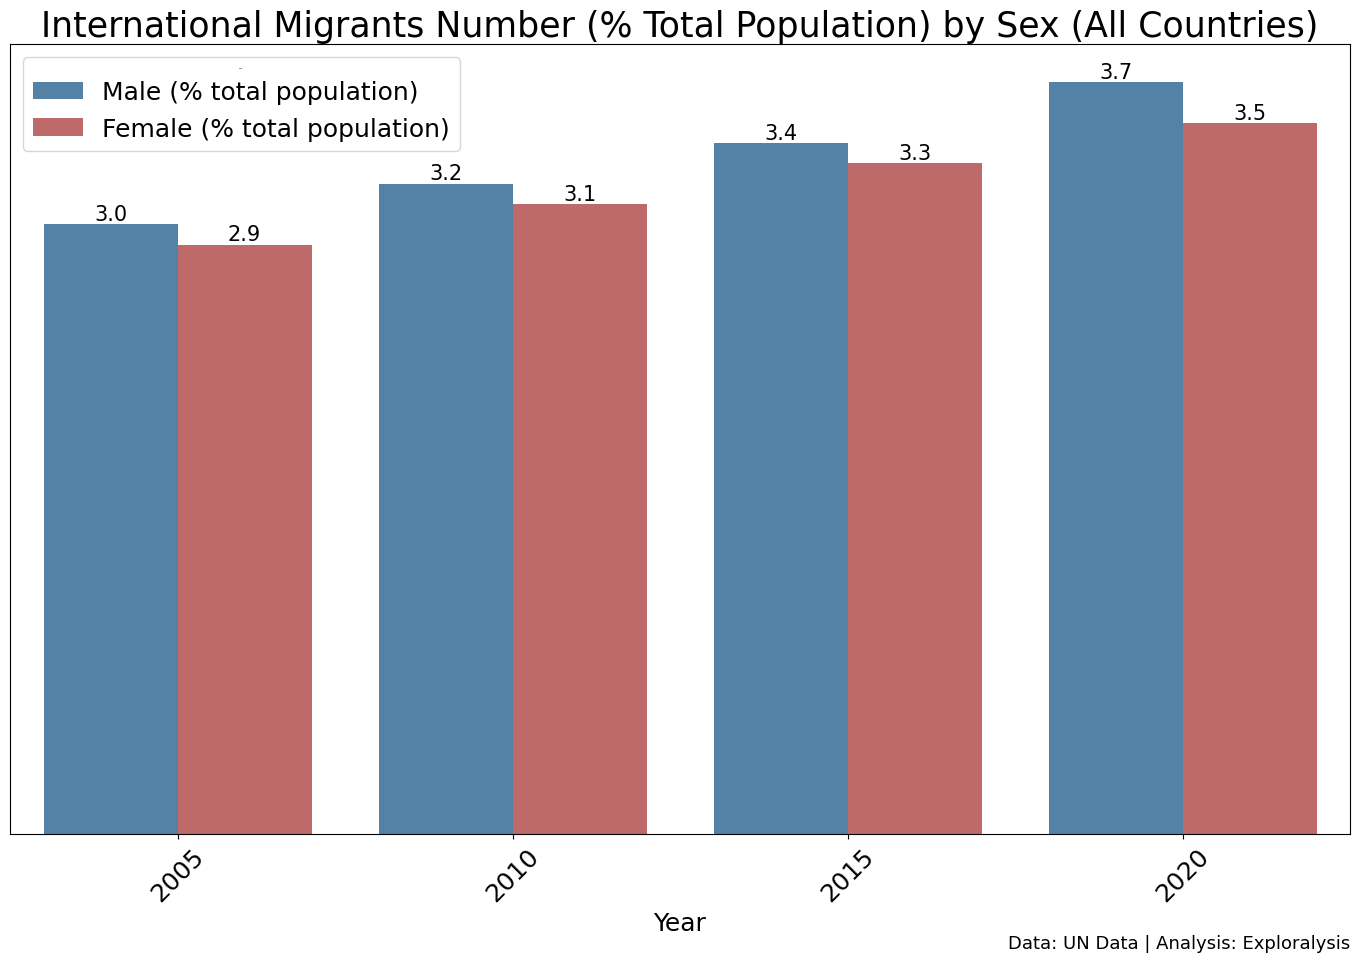
Gender Distribution of International Migrants
Globally, the gender ratio among international migrants closely mirrors the general population—almost equally split between males and females, with males having a slightly higher proportion. This suggests there are no strong gender-based patterns or disparities in international migration trends, indicating that both men and women migrate at nearly equal rates.
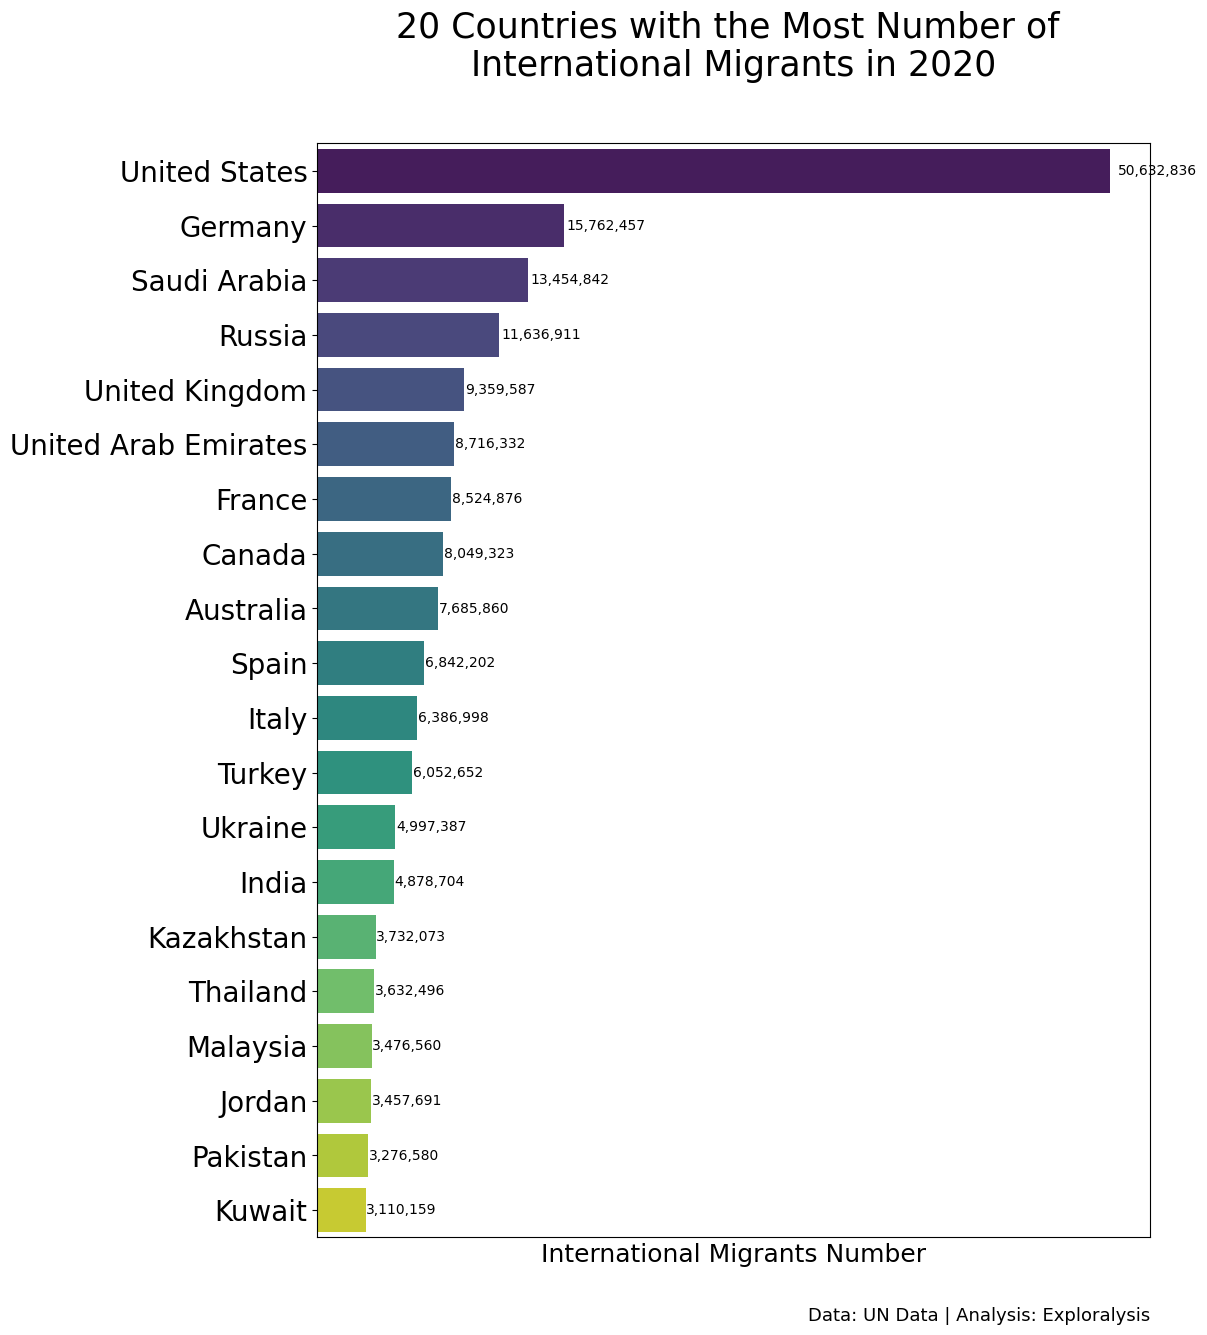
Top Countries by Number of International Migrants (2020)
The top 10 countries hosting the largest number of international migrants in 2020 were:
- United States
- Germany
- Saudi Arabia
- Russia
- United Kingdom
- United Arab Emirates (UAE)
- France
- Canada
- Australia
- Spain
These countries attract migrants for various reasons:
- The U.S., Canada, and Australia are historically known as immigration-friendly “melting pot” countries.
- Germany, the U.K., France, and Spain receive significant numbers of migrants from Africa, Asia, and conflict-affected regions nearby.
- Saudi Arabia and the UAE attract labor migrants due to economic development.
- Russia likely draws migrants from neighboring former Soviet states.
Notably, the U.S. hosts a far larger number of migrants compared to others. Germany and Saudi Arabia also rank high despite their relatively smaller populations. Surprisingly, populous countries like India, China, Indonesia, and Pakistan are largely absent from the top list—with only India ranking 14th.
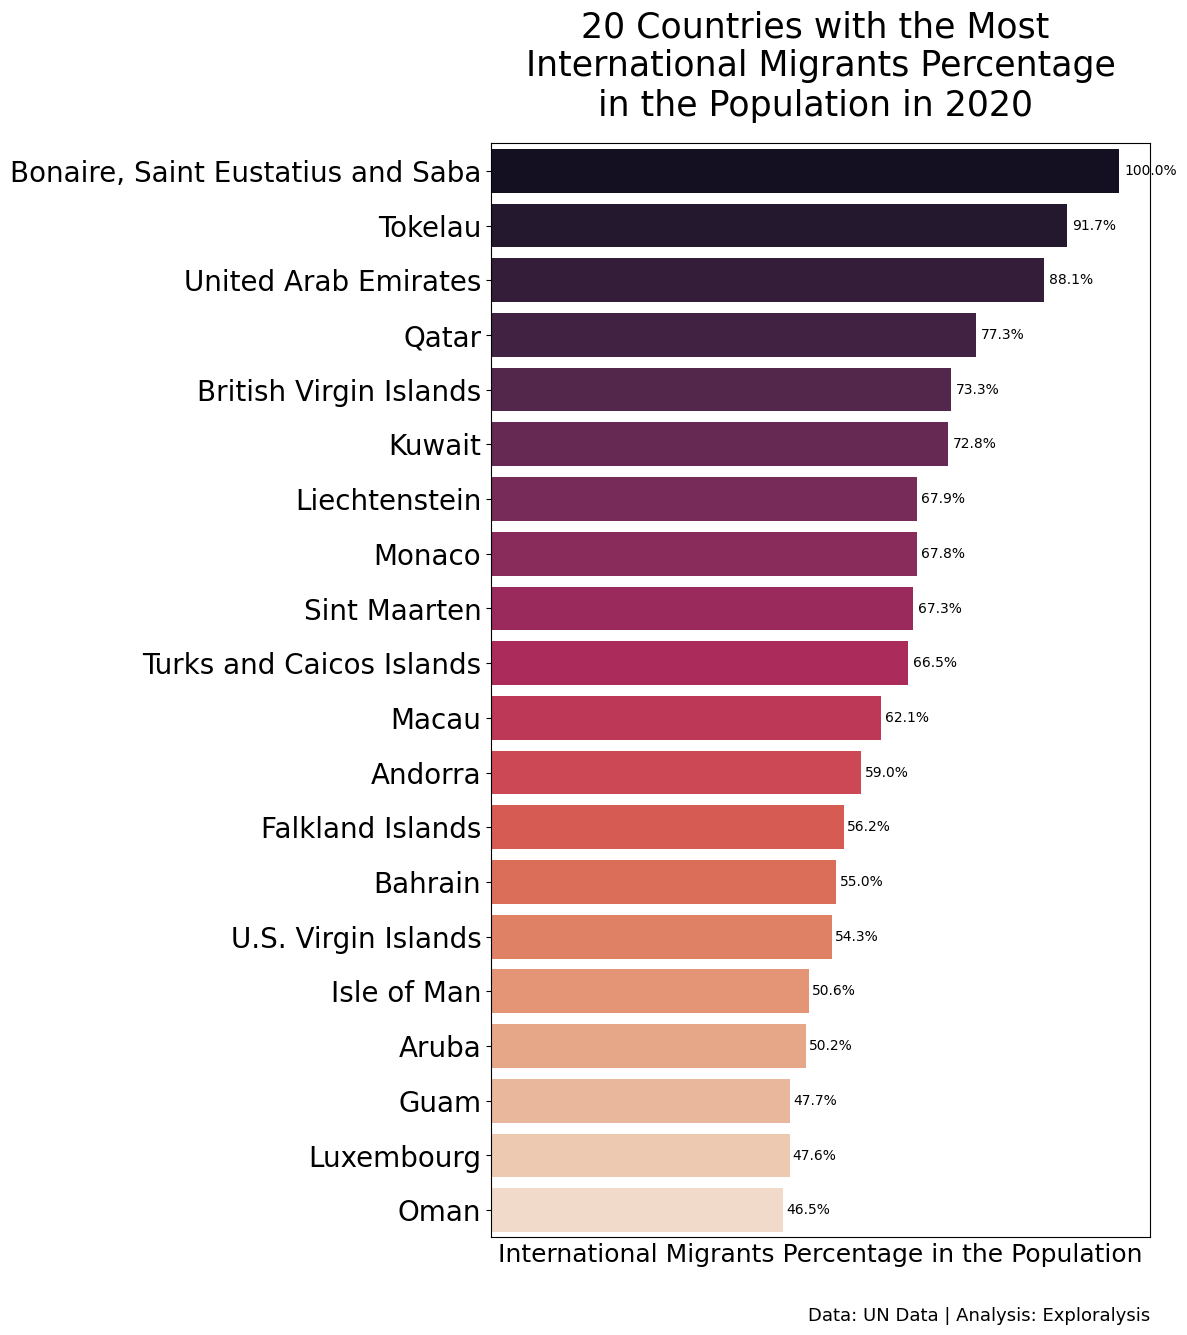
Countries with the Highest Migrant Population Percentage
The countries with the highest percentage of international migrants relative to their population include:
- Bonaire, Saint Eustatius and Saba (100%)
- Tokelau
- United Arab Emirates (UAE)
- Qatar
- British Virgin Islands
- Kuwait
- Liechtenstein
- Monaco
- Sint Maarten
- Turks and Caicos Islands
Most of these are small island nations or territories, where even a small influx of migrants greatly affects population percentages. In the top six, migrants make up more than 70% of the population. The inclusion of UAE, Qatar, and Kuwait reflects their reliance on foreign labor and low native population size.
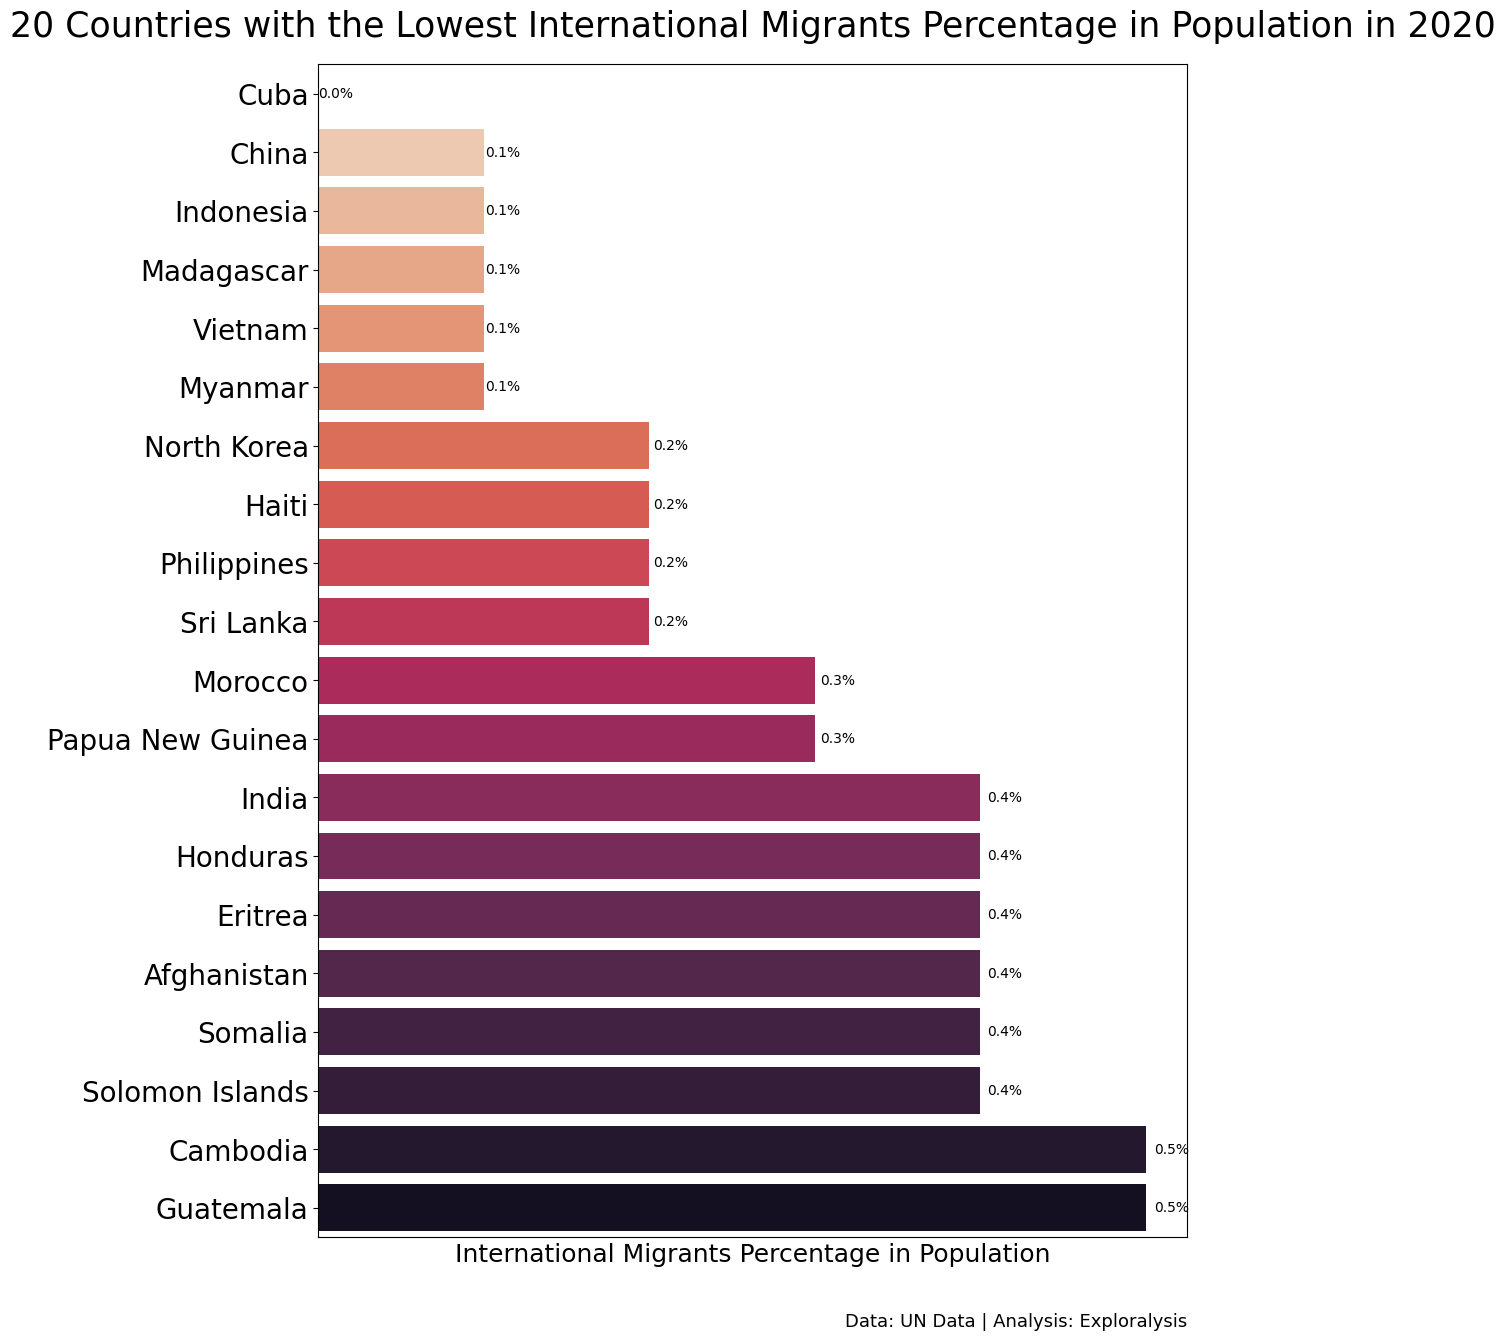
Countries with the Lowest Migrant Population Percentage
The 10 countries with the lowest proportion of international migrants are:
- Cuba (0.0%)
- China
- Indonesia
- Madagascar
- Vietnam
- Myanmar
- North Korea
- Haiti
- Philippines
- Sri Lanka
Notably, countries like China and Indonesia, despite being among the most populous in the world, have very low percentages of international migrants. This could indicate less attractiveness as migration destinations due to economic, political, or social factors. In Cuba’s case, the low number is likely tied to its political isolation and restrictive migration policies.
Who Are People of Concern According to UNHCR?
The United Nations High Commissioner for Refugees (UNHCR) defines “people of concern” as individuals who fall under the following categories:
- Refugees
- Internally Displaced Persons (IDPs)
- Asylum Seekers
- Stateless Persons
- Refugee Returnees
- Persons at Risk of Statelessness
- Others in Need of Protection
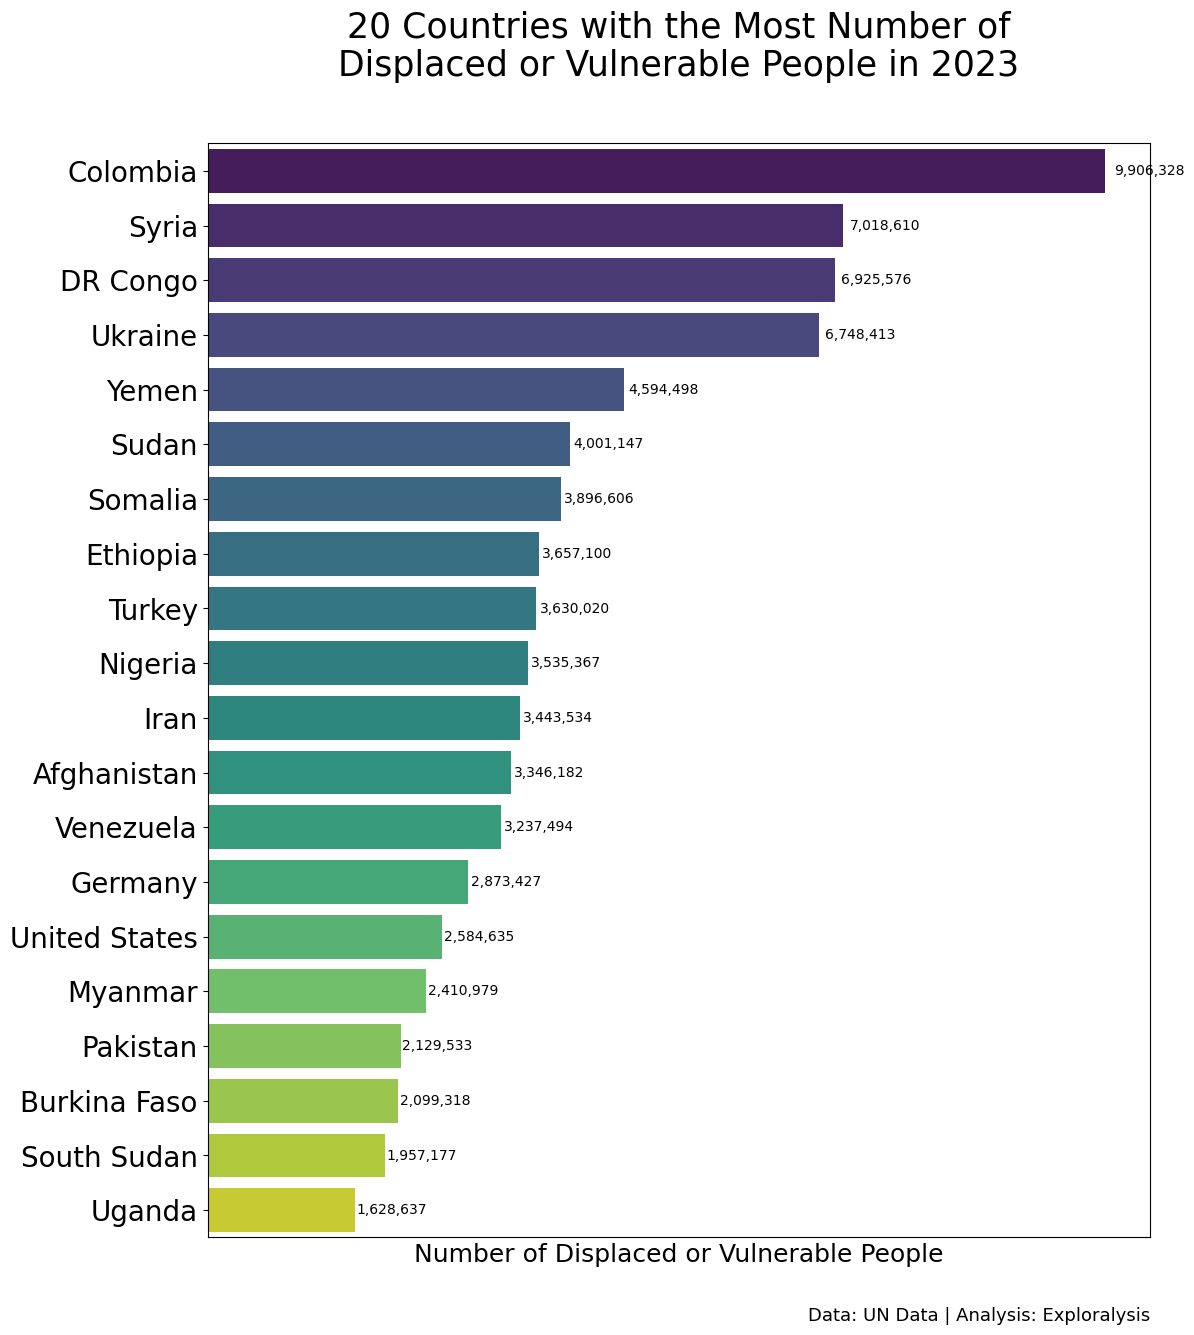
Countries with the Highest Number of Displaced and Vulnerable People (2023)
In 2023, the top 10 countries with the highest numbers of displaced and vulnerable people were:
- Colombia (~9.9 million)
- Syria
- Democratic Republic of the Congo (DR Congo)
- Ukraine
- Yemen
- Sudan
- Somalia
- Ethiopia
- Turkey
- Nigeria
These high numbers are largely driven by ongoing armed conflicts, ethnic and political tensions, economic collapse, food insecurity, and inflows of refugees from neighboring countries. For example:
- Turkey hosts millions of refugees from Syria.
- Colombia houses refugees from Venezuela, in addition to its own internally displaced people.
While global attention often focuses on Syria and Ukraine, the data suggests that Colombia and DR Congo are facing humanitarian crises of comparable scale.
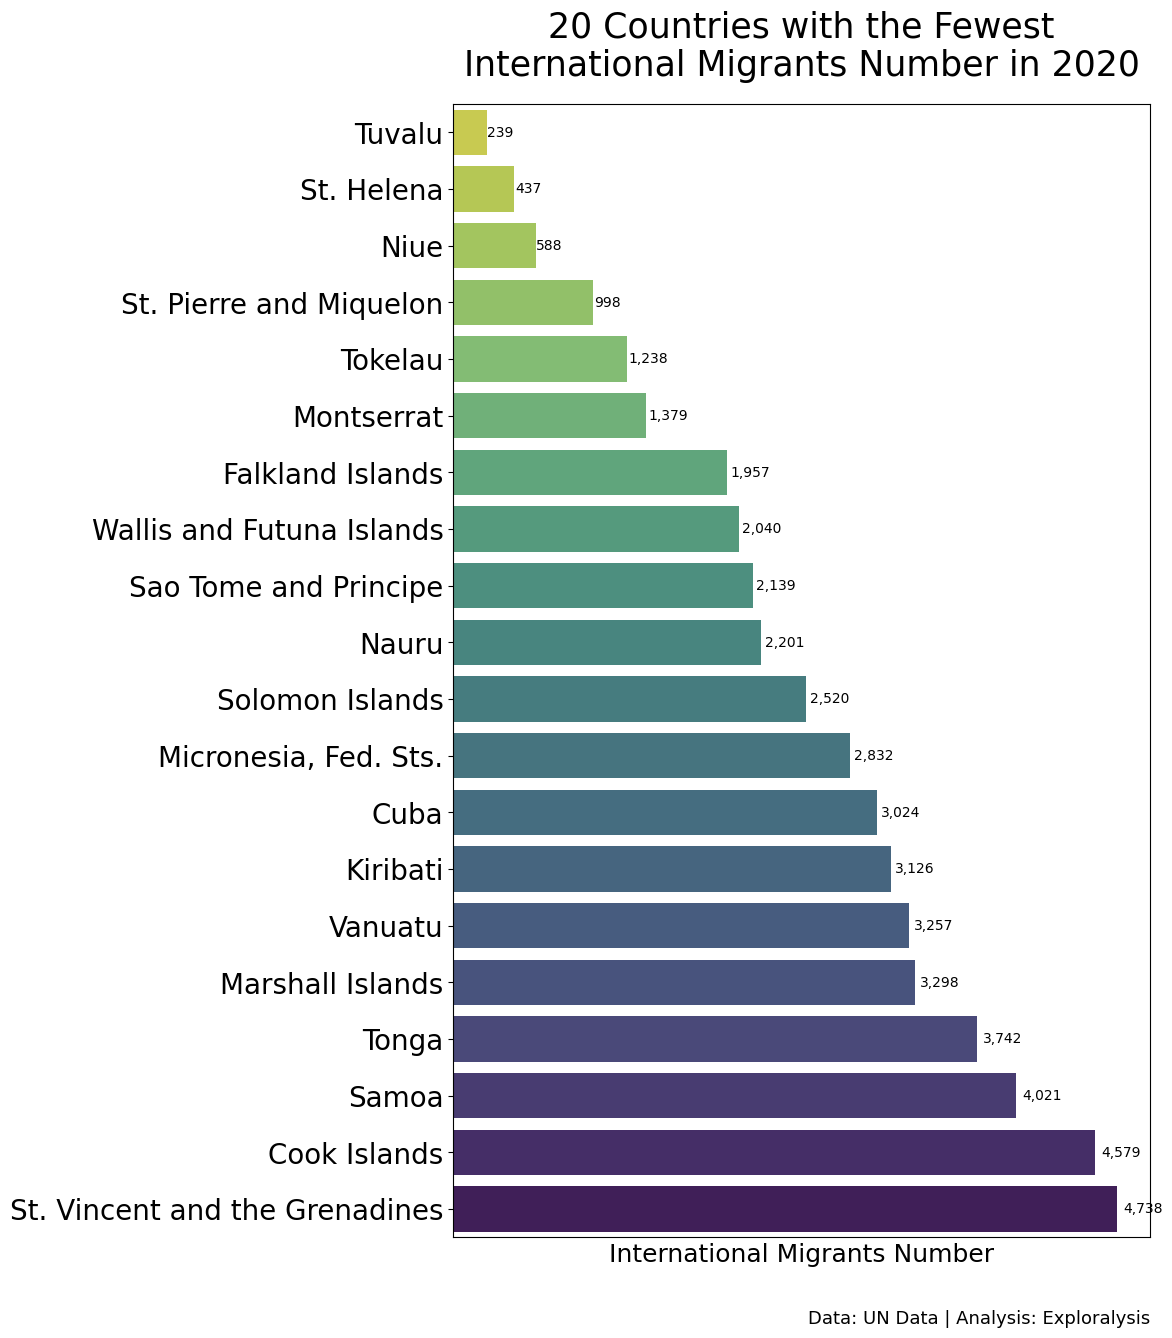
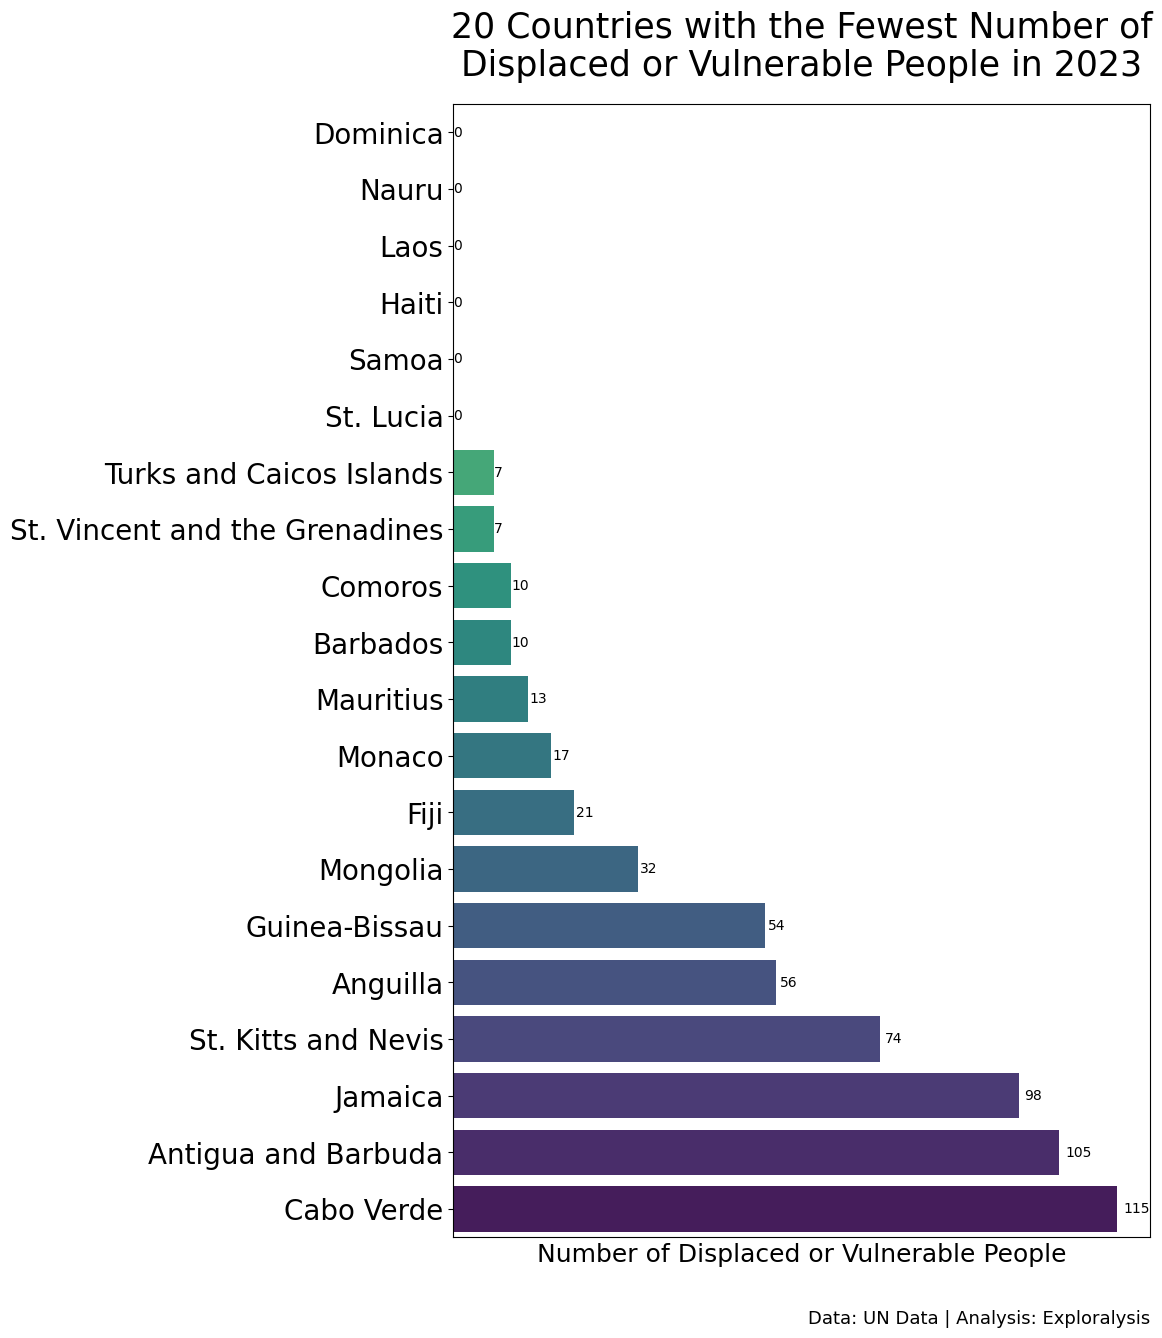
Countries with the Lowest Number of Displaced People (2023)
Unsurprisingly, the bottom 20 countries in terms of displaced and vulnerable populations are mostly small island nations, due to their low populations and political stability. A notable exception is Mongolia, a landlocked country bordered by China and Russia.
Interestingly, Haiti reported zero displaced or vulnerable people in 2023. This is remarkable given its 2010 earthquake, which left over 300,000 dead and displaced 1.5 million people. This may indicate a significant recovery by 2023.
Final Thoughts
This global migration and displacement data reveals nuanced trends and highlights the importance of context in understanding why people move or flee their homes. While some countries remain top destinations for economic migrants, others are deeply affected by forced displacement due to conflict or crisis. These trends should inform global policy responses, humanitarian aid allocation, and international cooperation.
( Nugroho Budianggoro )
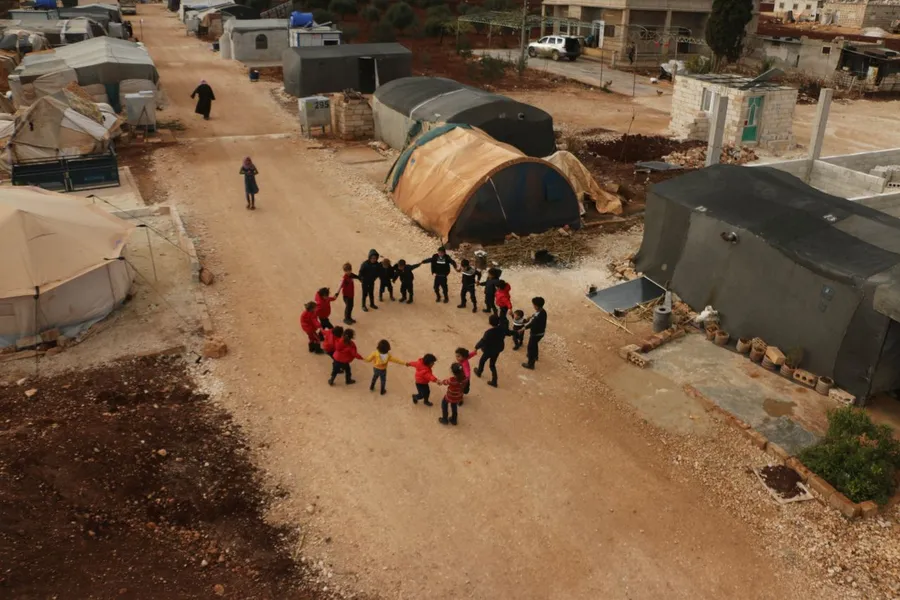
Cover photo by Ahmed akacha.