
Natural disasters affect millions of people every year. To see the real picture, I analyzed the Emergency Events Database (EM-DAT) from the Centre for Research on the Epidemiology of Disasters (CRED) at the University of Louvain, Belgium. This article covers natural disasters only, from January 2000 to January 2026.
EM-DAT records events that meet at least one of these criteria:
• 10 or more people killed
• 100 or more people affected
• International assistance requested
• State of emergency declared
Small, local events often go unreported, so the numbers focus on bigger disasters. The data comes from UN agencies, news outlets, NGOs, and research groups. The COVID-19 pandemic is excluded. Only natural disasters are included here (technological ones like industrial accidents are left out).
Natural disasters fall into five main categories:
• Geophysical (earthquakes, volcanoes)
• Meteorological (storms, cyclones)
• Hydrological (floods, landslides)
• Climatological (droughts, wildfires)
• Biological (epidemics)
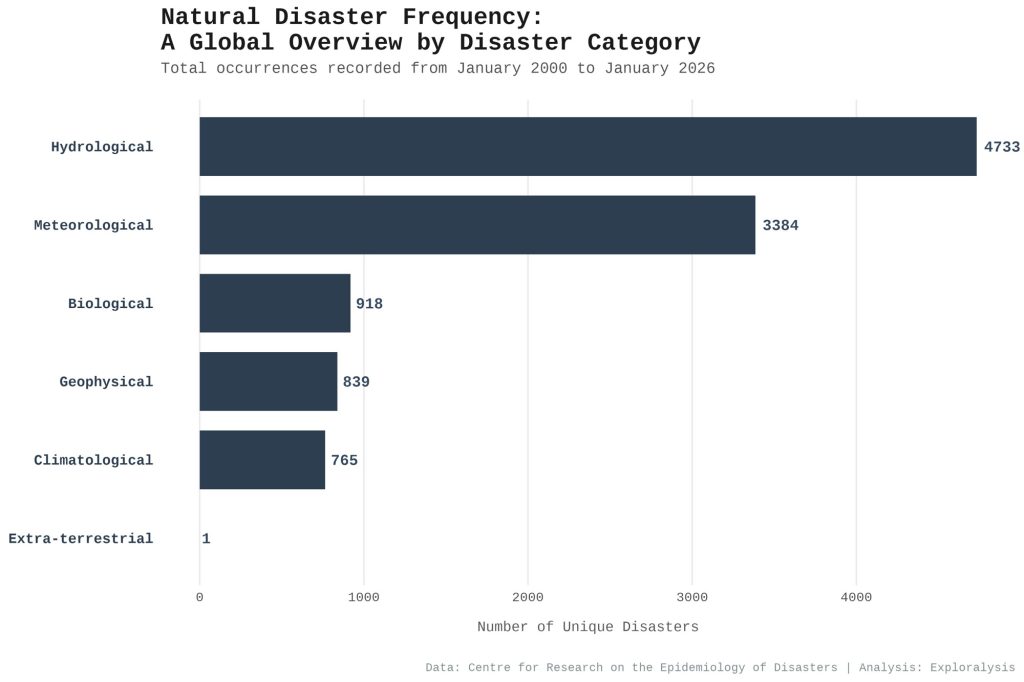
Below these are specific types and subtypes. I looked mainly at how many events happened and how many people were affected in total (injured + homeless).
Most Common Natural Disasters
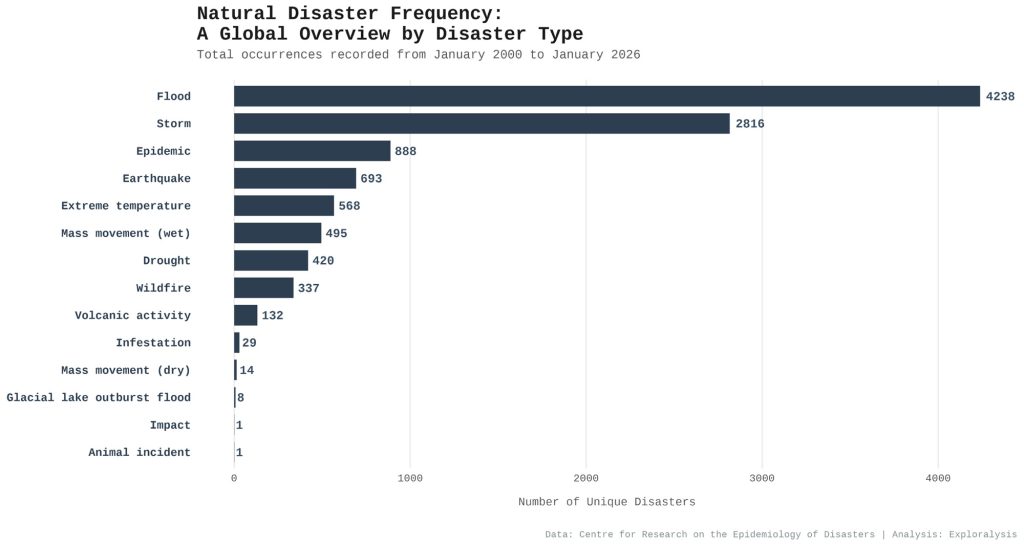
Floods top the list by a huge margin — 4,238 events (about 163 per year). Storms come second with 2,816 events (108 per year). Epidemics rank third. Other notable types include earthquakes, extreme temperatures, wet mass movements, droughts, and wildfires.
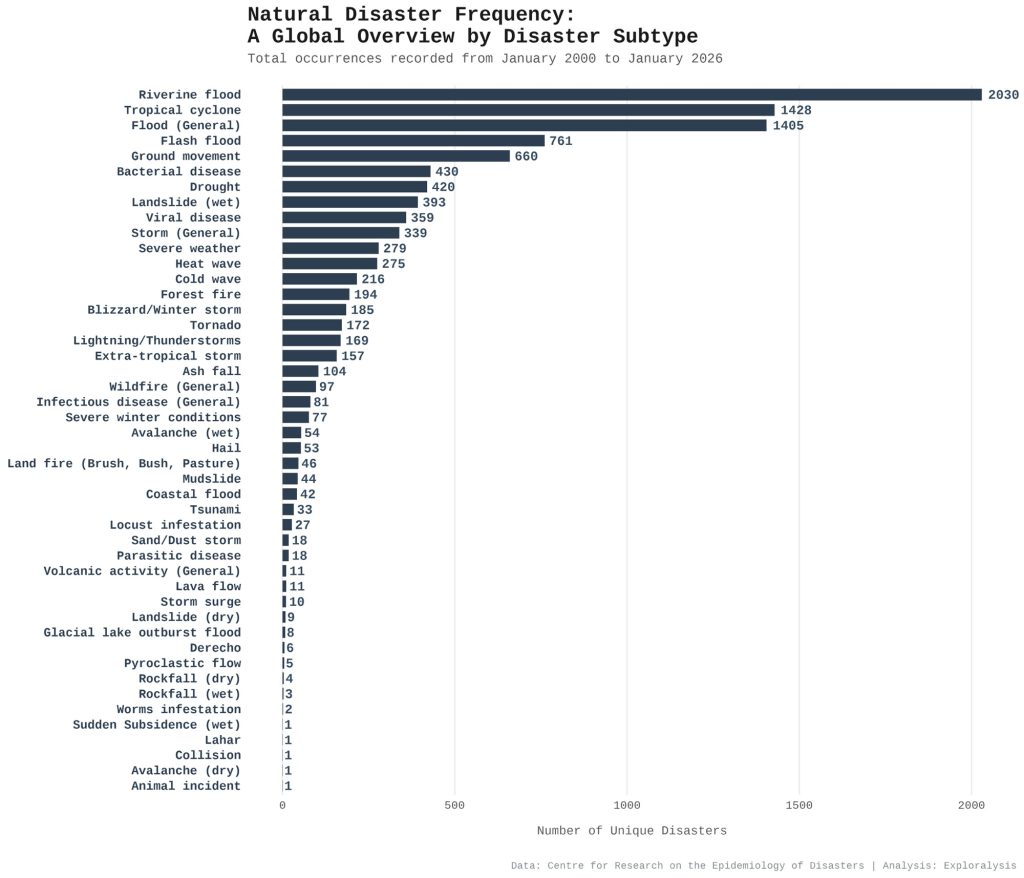
When we zoom into subtypes:
• Riverine floods lead with 2,030 events (78 per year)
• Tropical cyclones follow at 1,428 (55 per year)
• General floods sit at 1,405 (54 per year)
Flash floods and ground movements (landslides) also appear frequently.
Which Countries and Regions Are Hit Most Often?
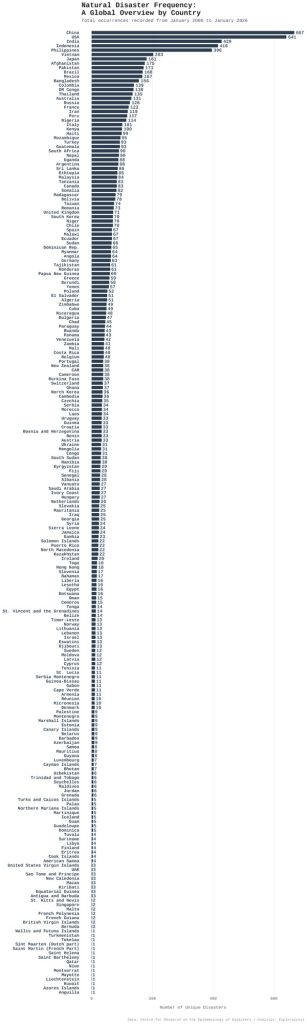
The top five countries for total events are:
1. China – 667 events (26 per year)
2. United States – 641 events (25 per year)
3. India – 428 events (16 per year)
4. Indonesia – 416 events (16 per year)
5. Philippines – 396 events (15 per year)
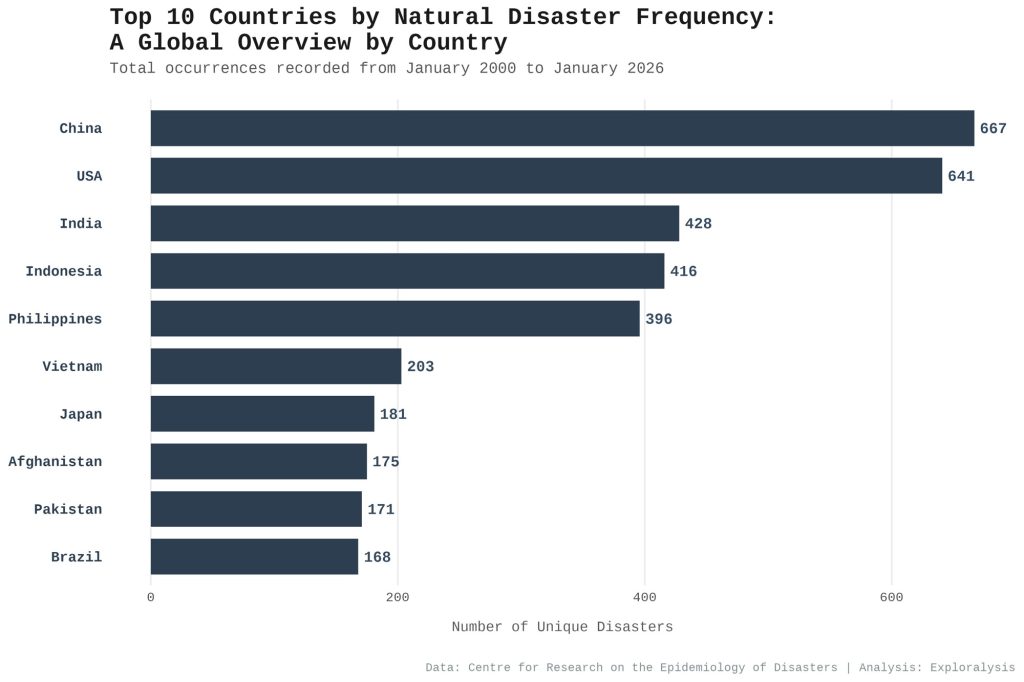
These numbers largely match population size, except for the Philippines, which stands out because of frequent storms.
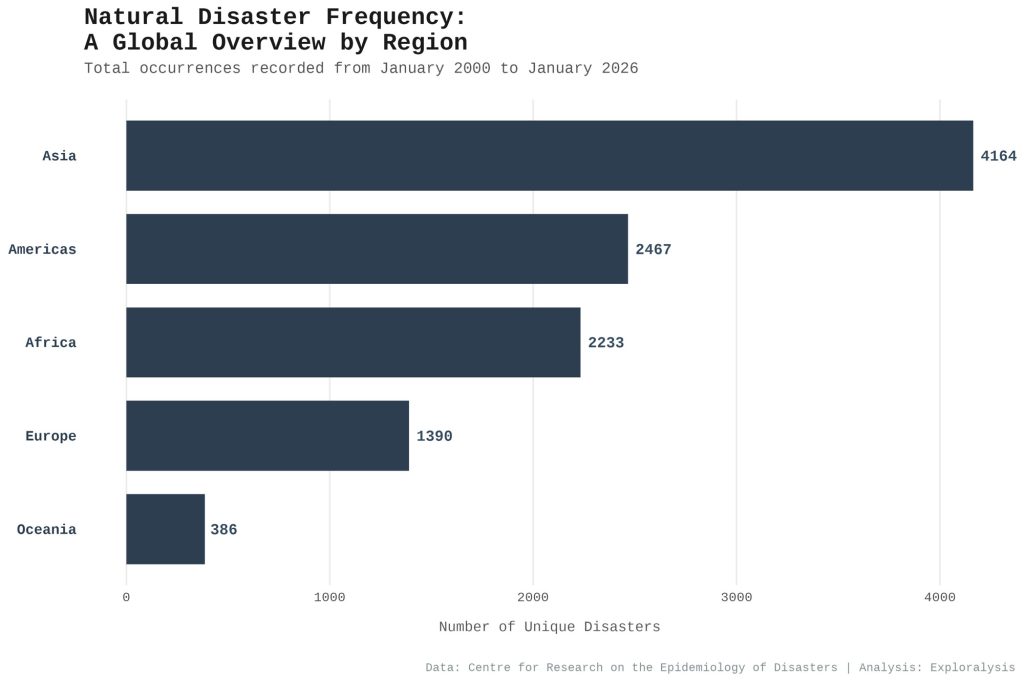
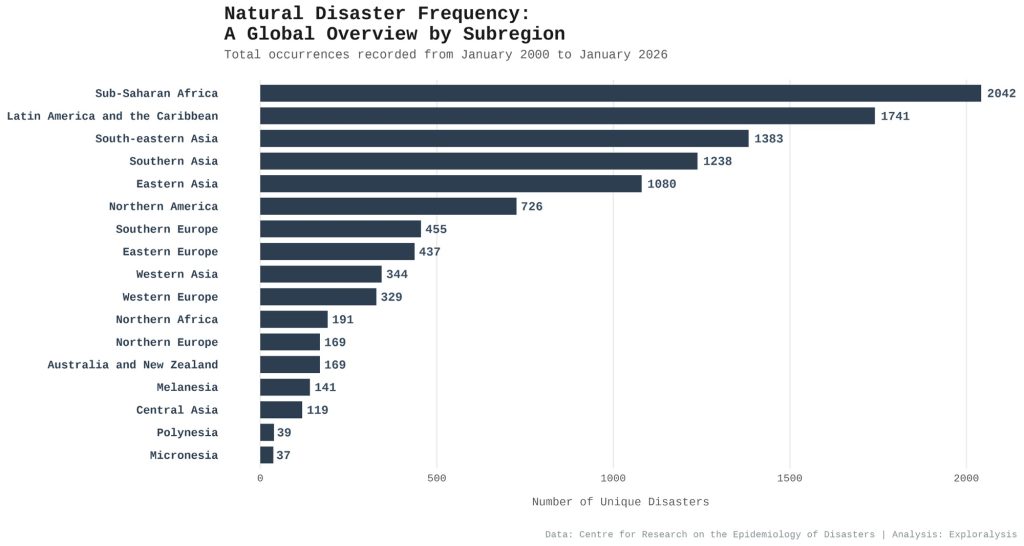
By region, Asia leads with 4,164 events (160 per year). The Americas and Africa follow. Within Africa, Sub-Saharan Africa reports the highest numbers. The other busy sub-regions are Latin America & the Caribbean, South-Eastern Asia, South Asia, and Eastern Asia.
How Many People Are Affected?
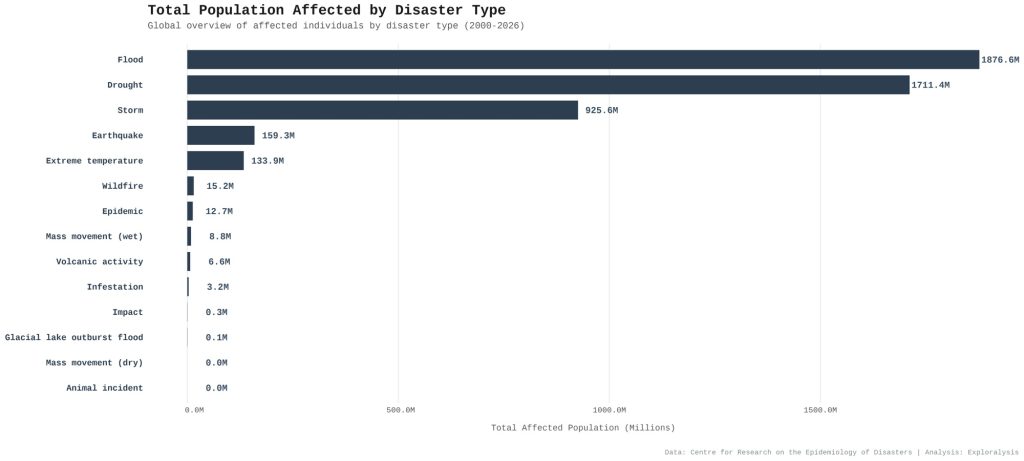
Total people affected tells a slightly different story. The leaders are:
• Floods – 1,876.6 million people (72 million per year)
• Droughts – 1,711.4 million (66 million per year)
• Storms – 925.6 million (36 million per year)
• Earthquakes – 159.3 million (6 million per year)
• Extreme temperatures – 133.9 million (5 million per year)
Droughts affect far more people than their occurrence count suggests — one bad drought can impact tens of millions.
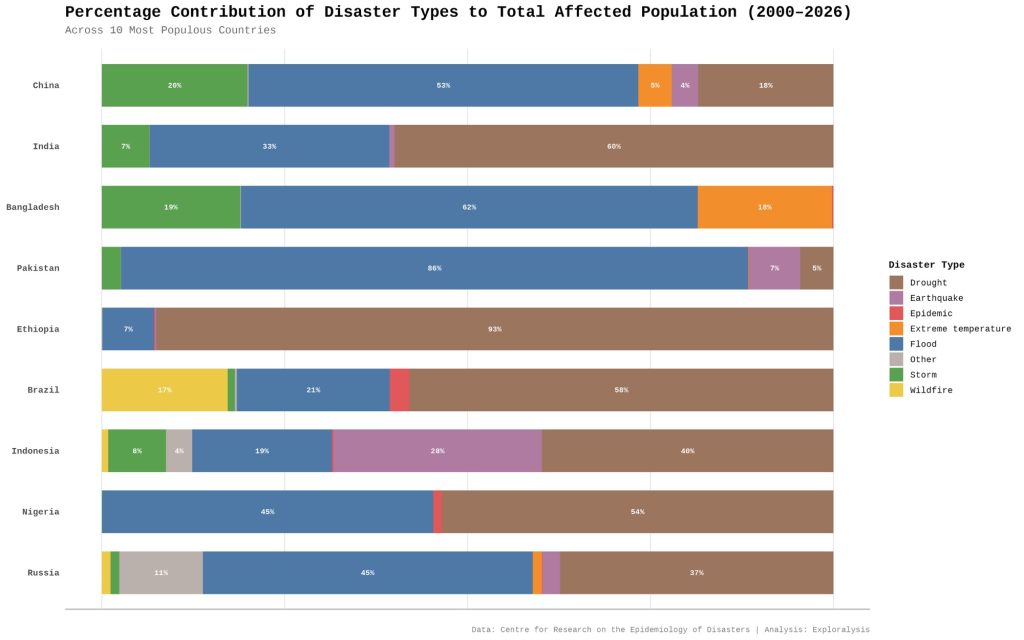
In the 10 most populous countries, floods and droughts dominate the affected population in seven of them. Ethiopia is almost entirely drought-driven (93 % of affected people). Pakistan (86 %) and Bangladesh (62 %) are flood-heavy. Other notable impacts include earthquakes in Indonesia, storms in China and Bangladesh, extreme temperatures in Bangladesh, and wildfires in Brazil.
Deep Dive: Floods
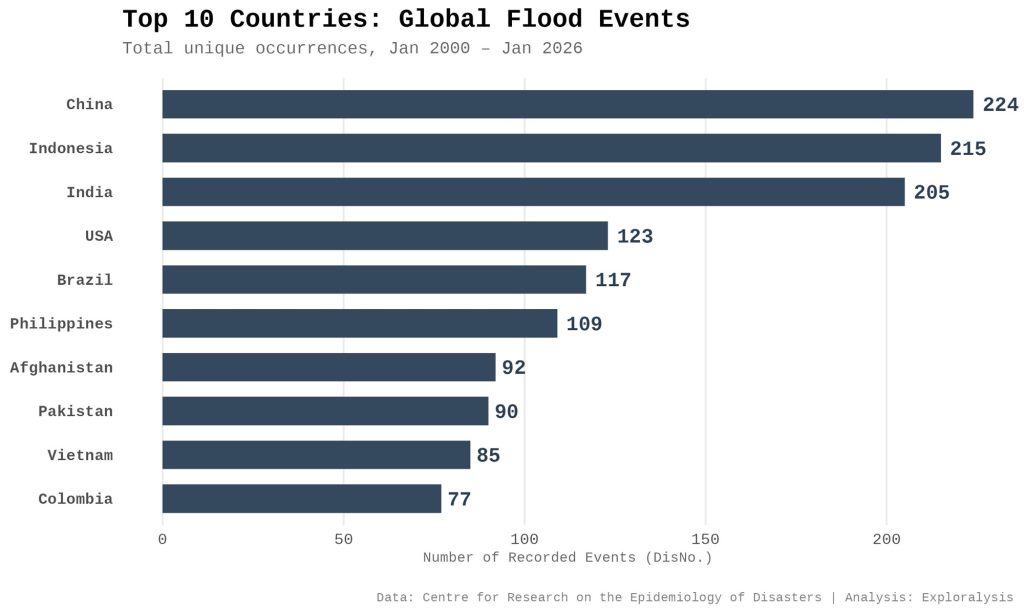
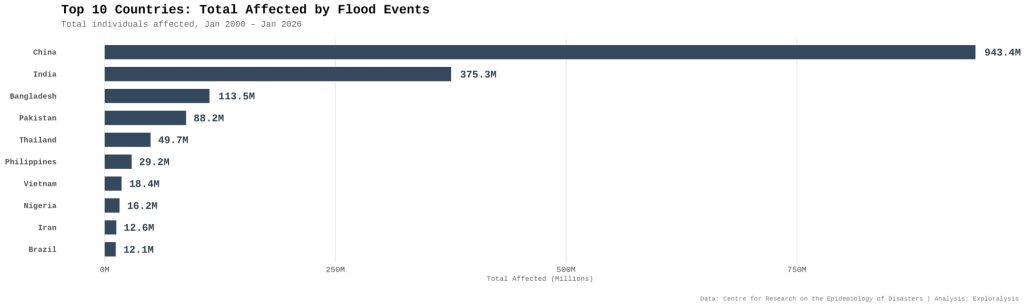
China, Indonesia, and India lead in flood events. China and India also top the list for people affected (943 million and 375 million respectively). Eight of the top 10 countries for both events and people affected are in Asia.
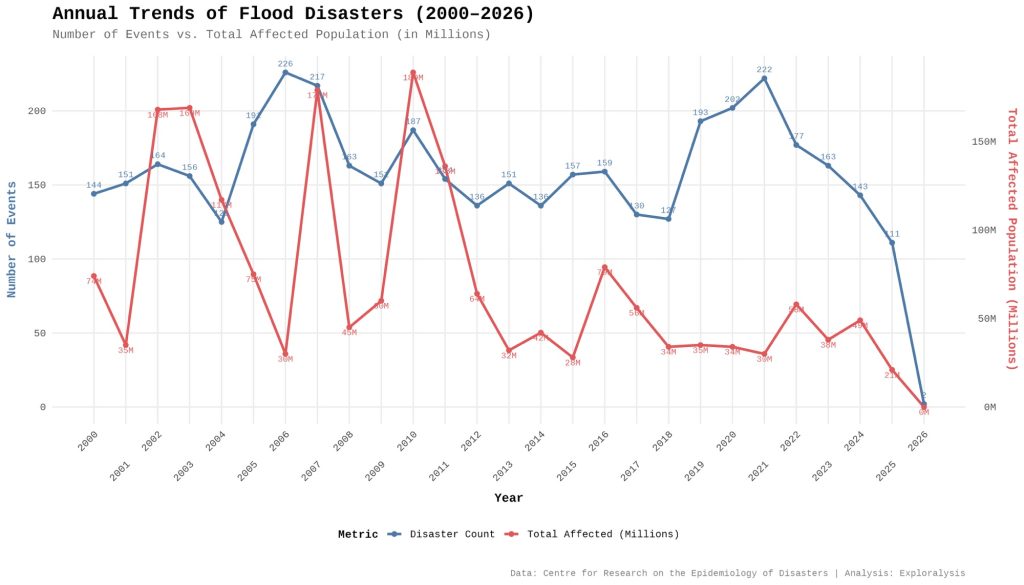
Over 26 years, flood numbers and people affected move up and down without a clear long-term rise or fall. We might expect more floods from climate change, but the data does not yet show a strong upward trend.
Deep Dive: Storms
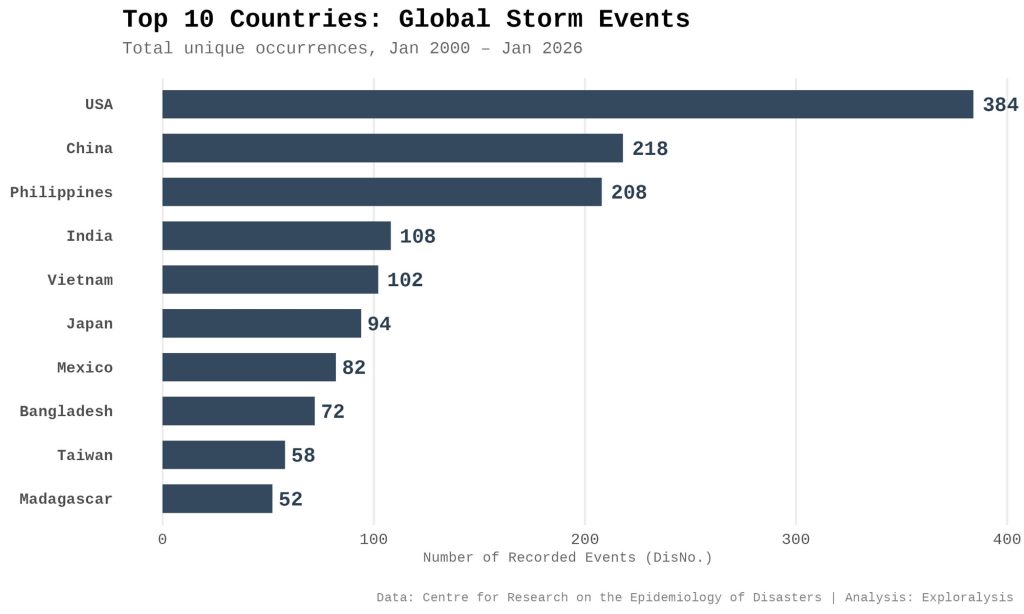
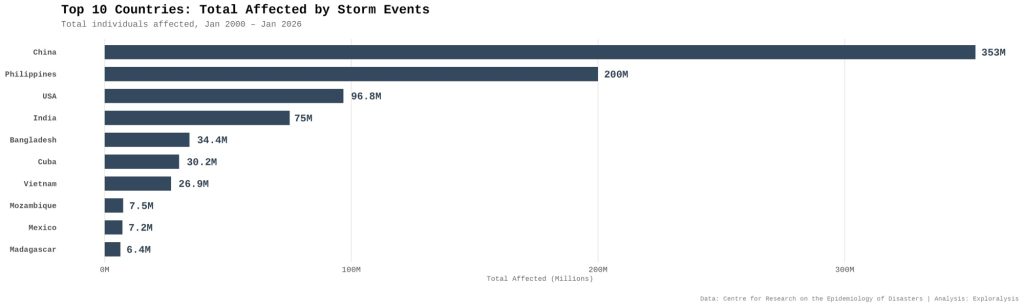
The United States leads in storm events (384), followed by China and the Philippines. China and the Philippines suffer the most people affected (353 million and 200 million). Seven of the top 10 event countries are Asian; five of the top 10 affected countries are Asian.
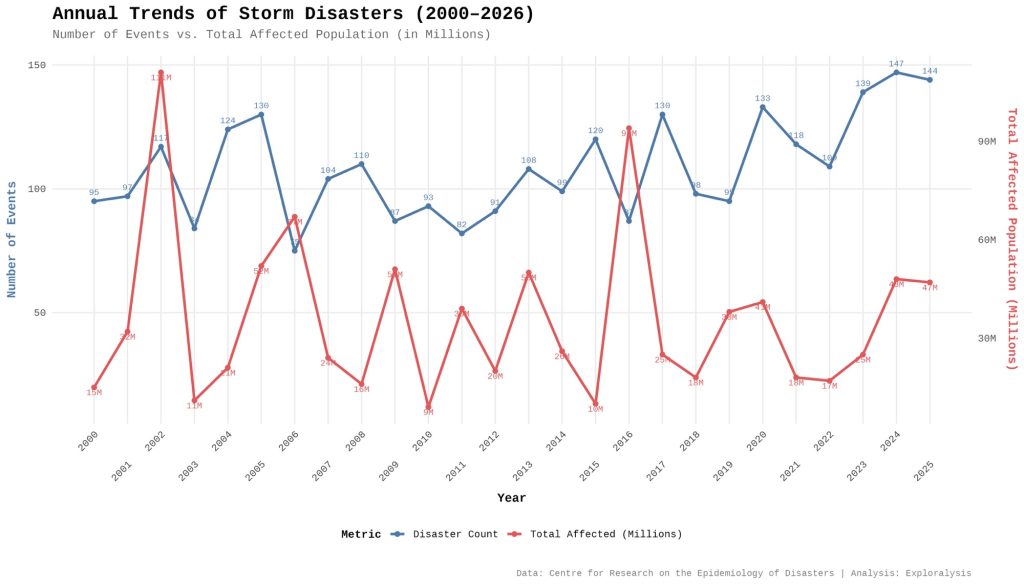
Storm events show a gentle upward trend since 2011 — something many link to climate change. People affected loosely follow the number of events.
Deep Dive: Epidemics
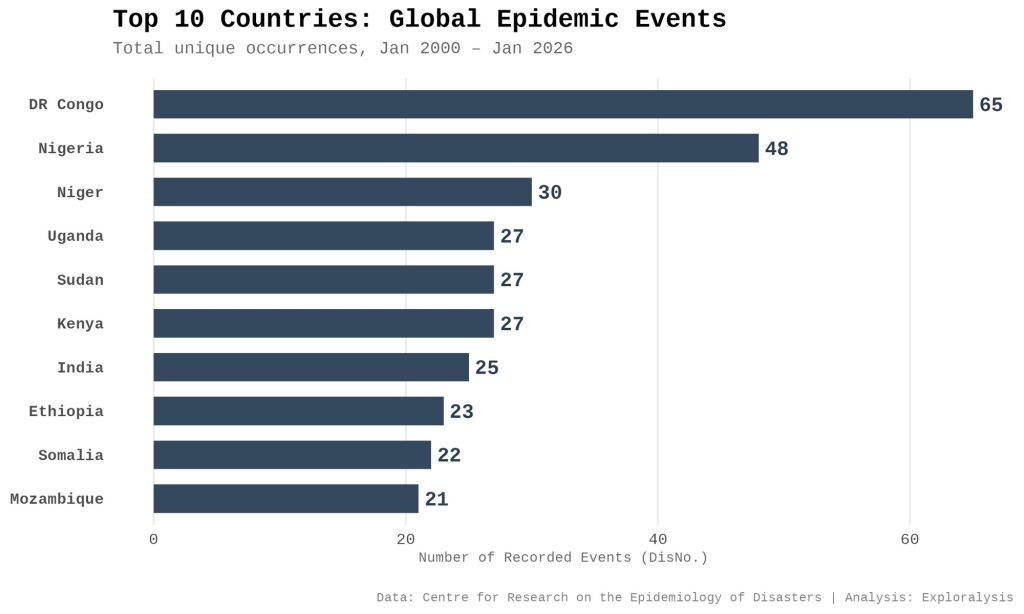
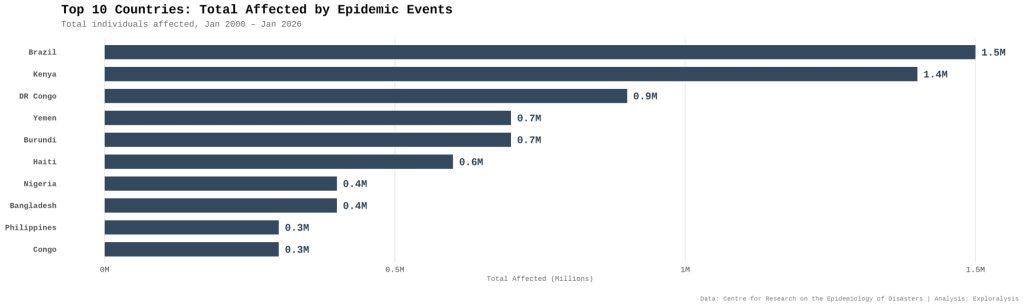
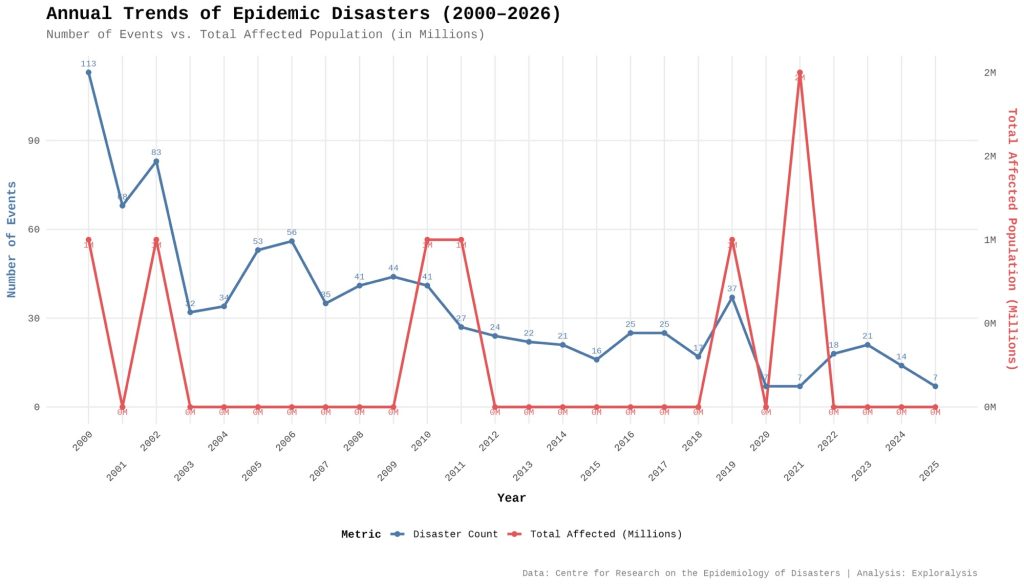
Nine of the top 10 countries for epidemic events are in Africa (Democratic Republic of Congo and Nigeria lead). People affected tell a different story — Brazil and Kenya top the list, showing that a few severe outbreaks (dengue, Zika, Ebola, cholera) can affect many even if events are fewer. Epidemic numbers dropped sharply after 2002 and continued a slow decline. People affected stayed mostly flat after 2003, with spikes in 2010–2011, 2019, and 2021.
Deep Dive: Earthquakes
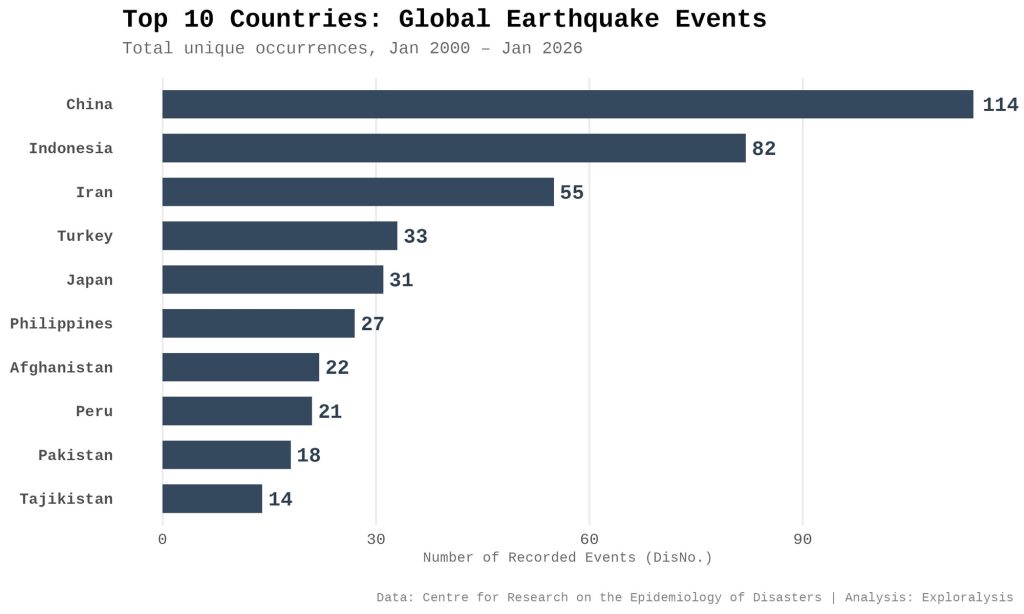
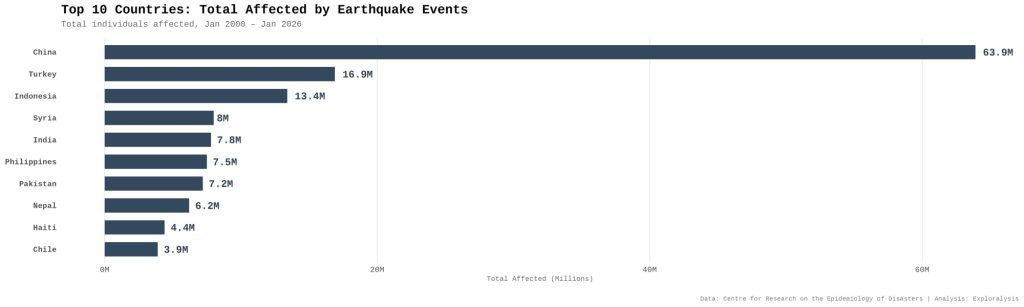
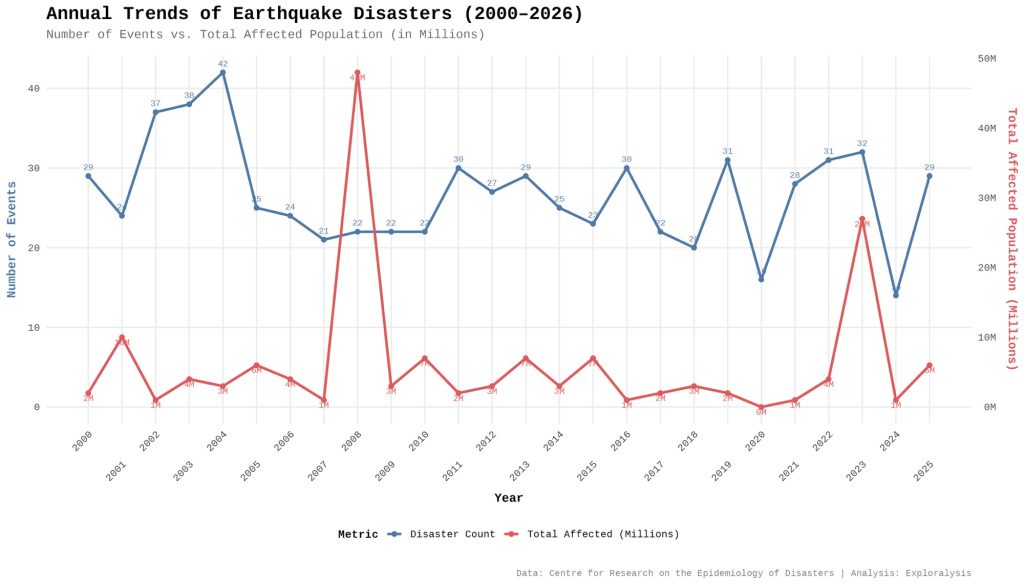
China and Indonesia lead in events; China, Turkey, and Indonesia lead in people affected. Nine of the top 10 event countries and eight of the top 10 affected countries are Asian. Numbers stay fairly flat overall, with big spikes in affected people in 2008 (Sichuan, China) and 2023 (Turkey-Syria).
Deep Dive: Extreme Temperatures
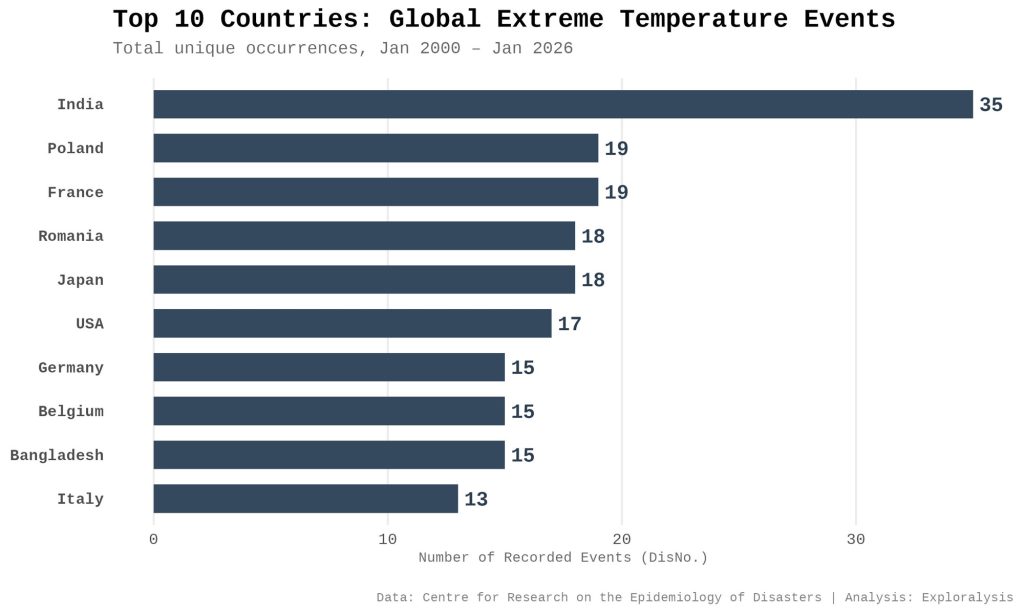
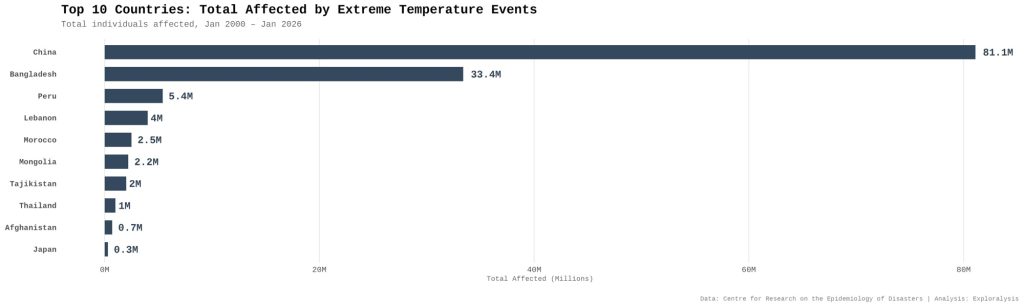
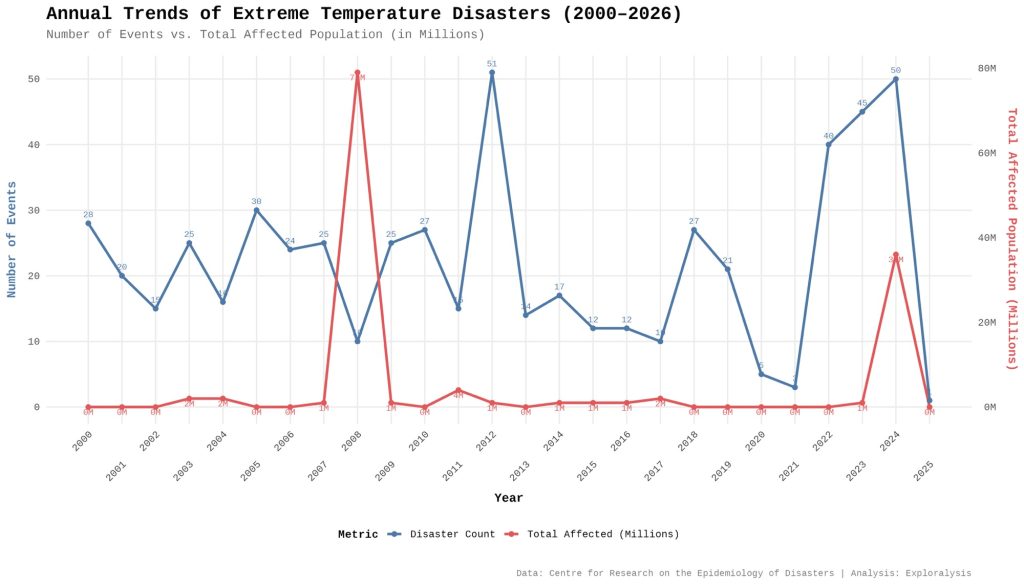
India reports the most events, but European countries fill many of the other top spots. China and Bangladesh top people affected. Occurrence numbers slowly declined until 2020, then spiked again in 2022–2024 before dropping in 2025. Affected numbers stay flat except for jumps in 2008 and 2024 (the warmest year on record at the time).
Deep Dive: Wet Mass Movements
(landslides and similar events triggered by heavy water content)
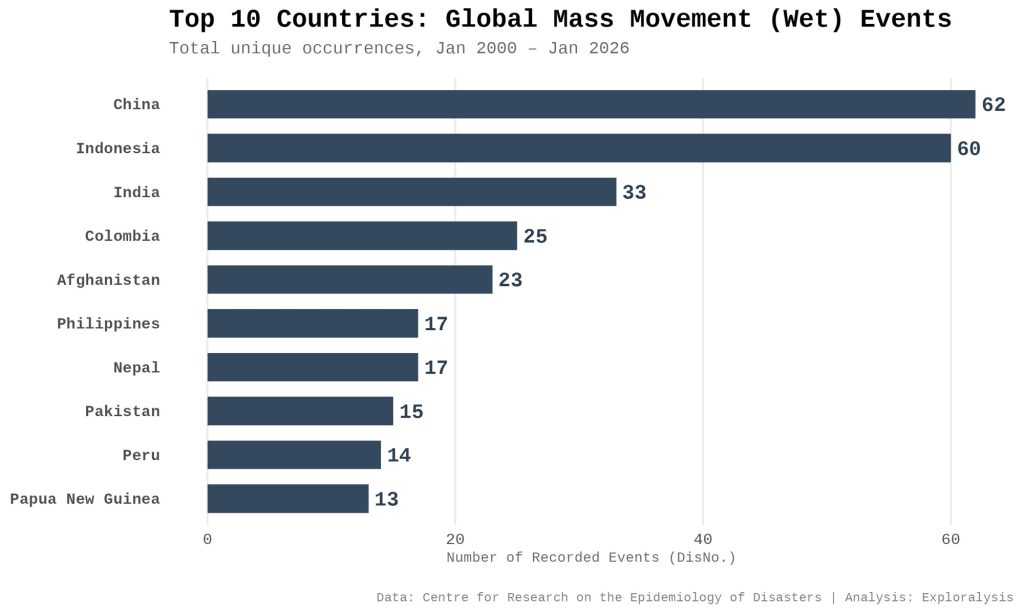
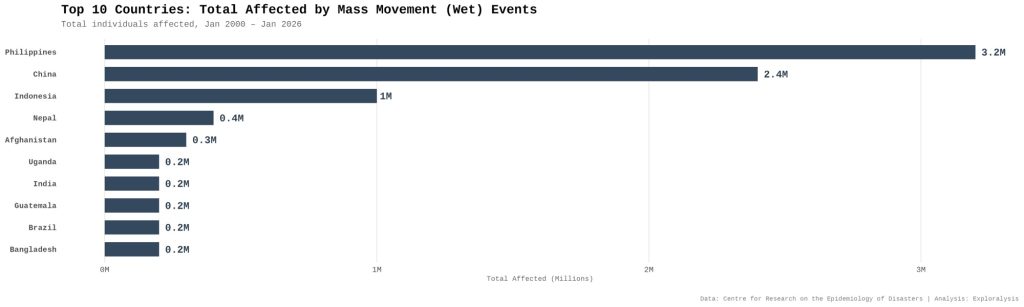
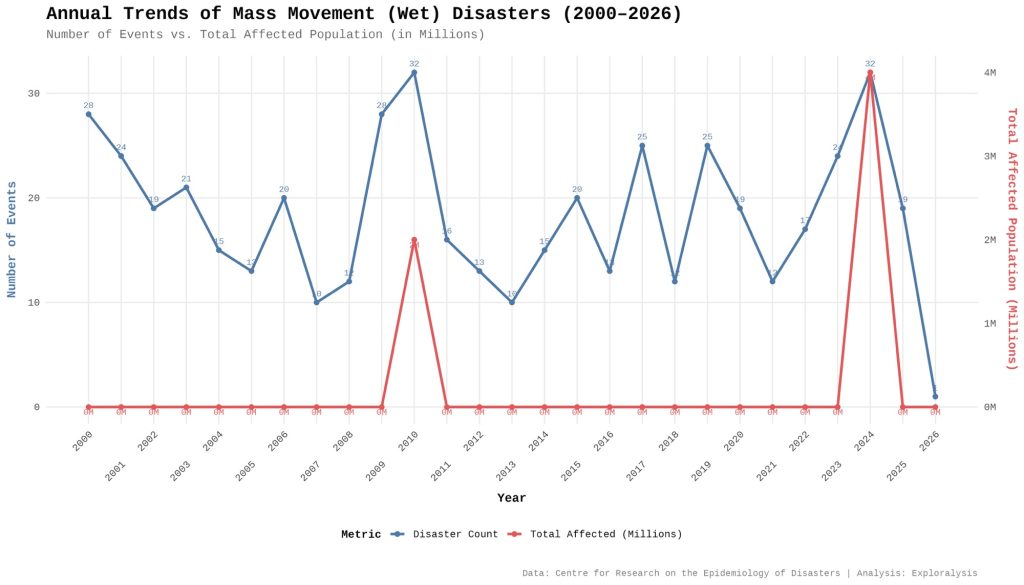
China and Indonesia lead in events; Philippines, China, and Indonesia lead in people affected. Most top countries are Asian. Numbers fluctuate but stay roughly flat. Big affected spikes occurred in 2010 (Gansu, China mudslide) and 2024.
Deep Dive: Droughts
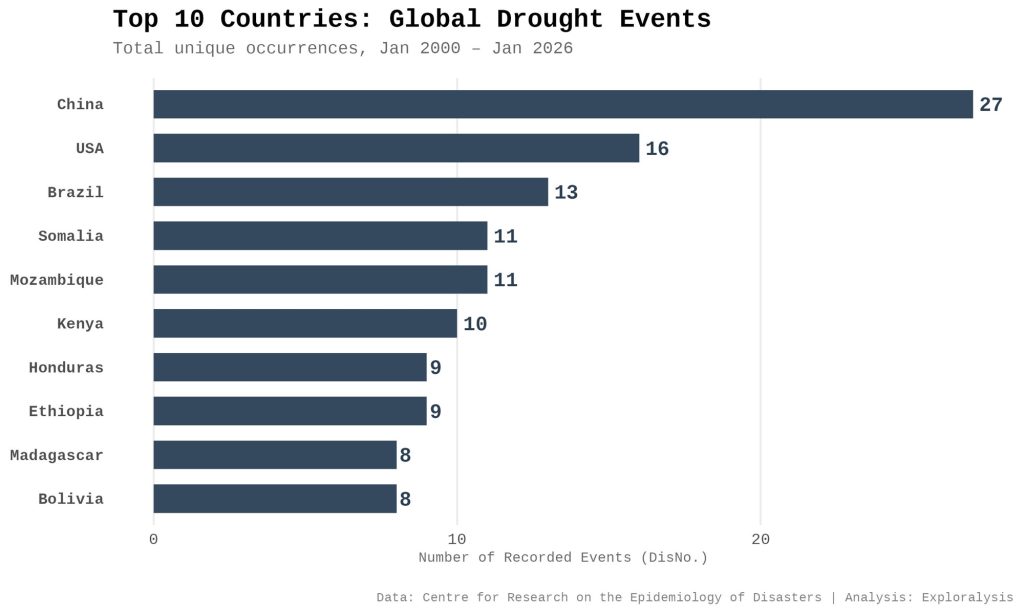
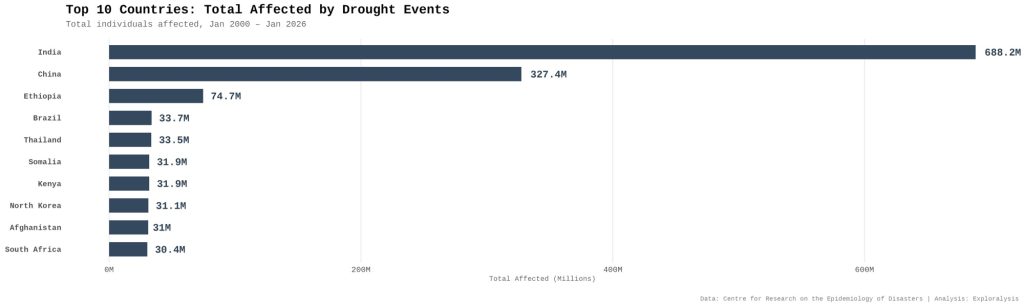
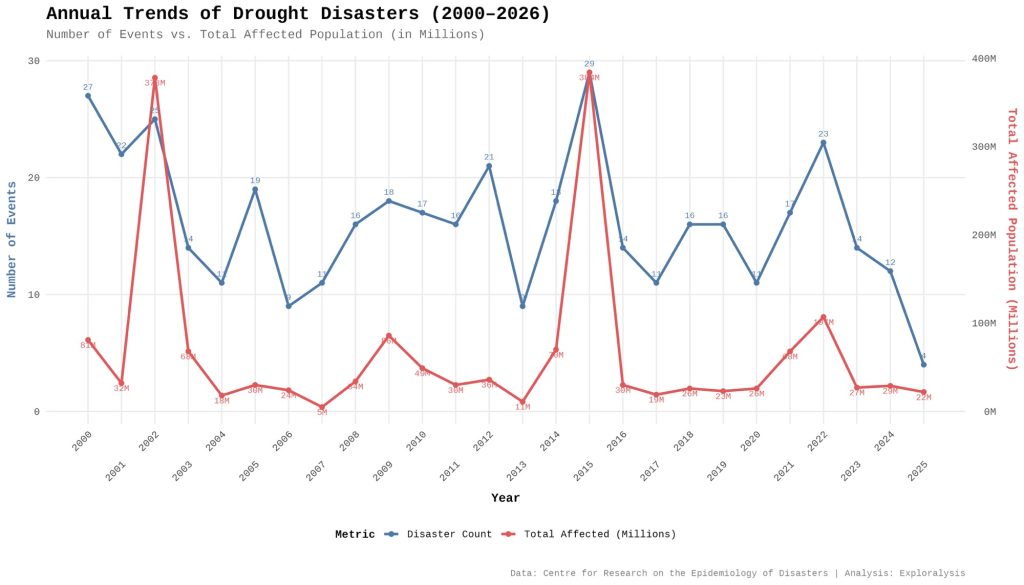
China leads in events; half the top 10 event countries are African. India and China top people affected by a wide margin (688 million and 327 million). India barely appears in the event list, showing how a single large drought can affect huge numbers. Five of the top 10 affected countries are Asian. Numbers declined early on then flattened with big swings. Major affected spikes hit in 2002, 2015 (linked to El Niño), and 2022.
Deep Dive: Wildfires
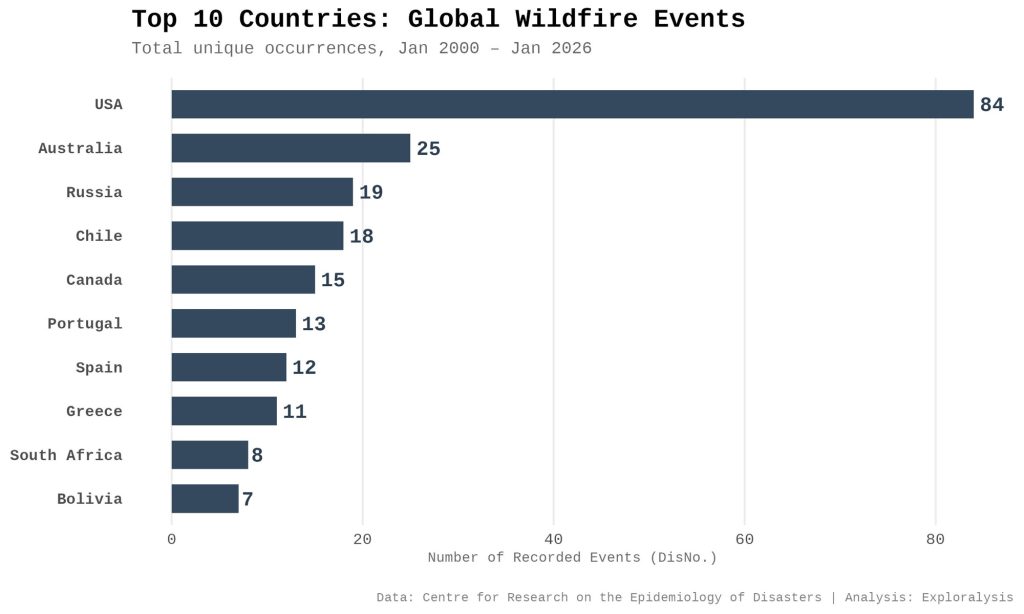
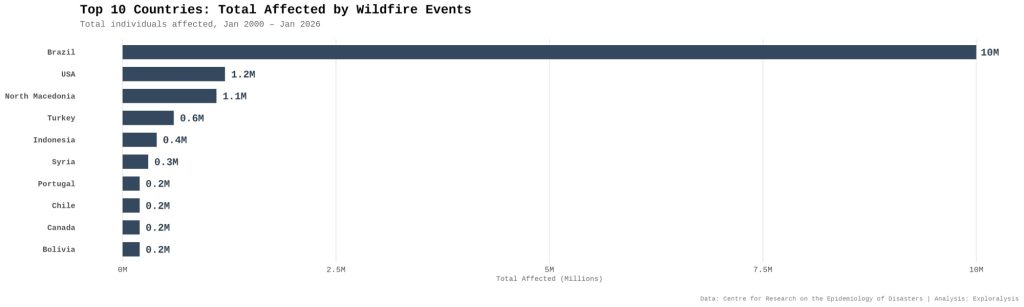
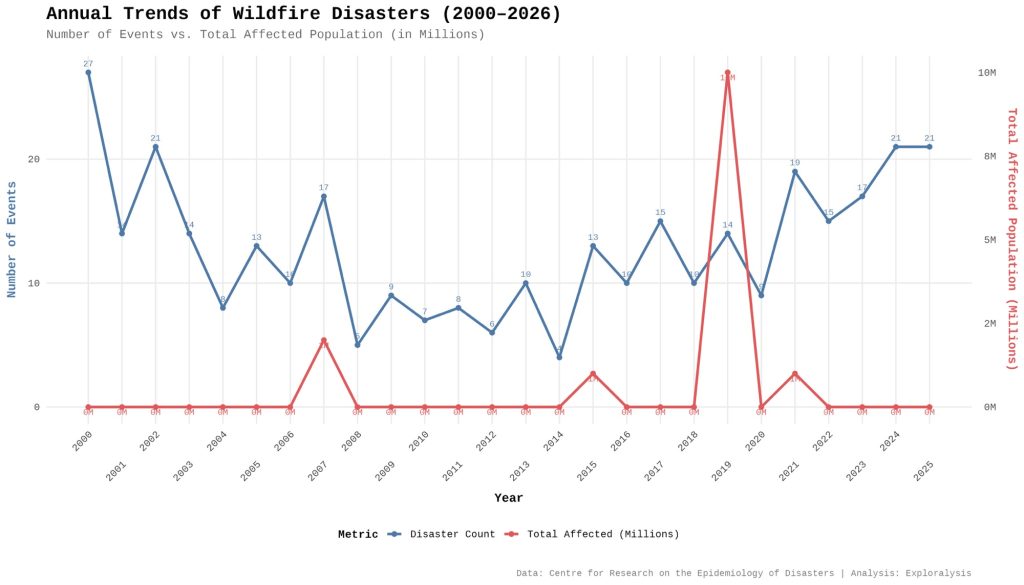
The United States leads in events. Brazil tops people affected (10 million). Events dropped until 2008, then rose again from 2015 onward. Affected numbers stay mostly flat with a big spike in 2019 (Amazon, Australia, North America, Russia).
Key Takeaways from 26 Years of Data
• Floods and storms happen far more often than anything else. Floods, droughts, and storms affect the most people.
• A country or year with fewer events can still see huge impacts if one disaster is especially severe.
• Occurrence numbers often track population size, but the Philippines stands out because of storms.
• Wildfires and storms show signs of increasing — consistent with climate change expectations. Epidemics have declined.
• Asia dominates both events and people affected for most disaster types. Africa appears strongly in epidemics and droughts.
The EM-DAT dataset gives us a clear, consistent view of where natural disasters hit hardest and who suffers most. While small events are missing, the patterns for major disasters are unmistakable: floods and storms are the everyday reality for millions, droughts can quietly devastate entire regions, and a single big earthquake or wildfire can change the numbers overnight.
Understanding these trends helps governments, aid organizations, and communities prepare better. The data is sobering, but it also shows exactly where action is needed most.
Stay safe out there — and keep an eye on the weather.
By: Nugroho Budianggoro
Cover photo by Pok Rie