
This analysis uses the latest population data from the United Nations, specifically the Population, Surface Area, and Density dataset. You can access the data here: UN Data CSV File.
Top 25 Most Populous Countries in 2024
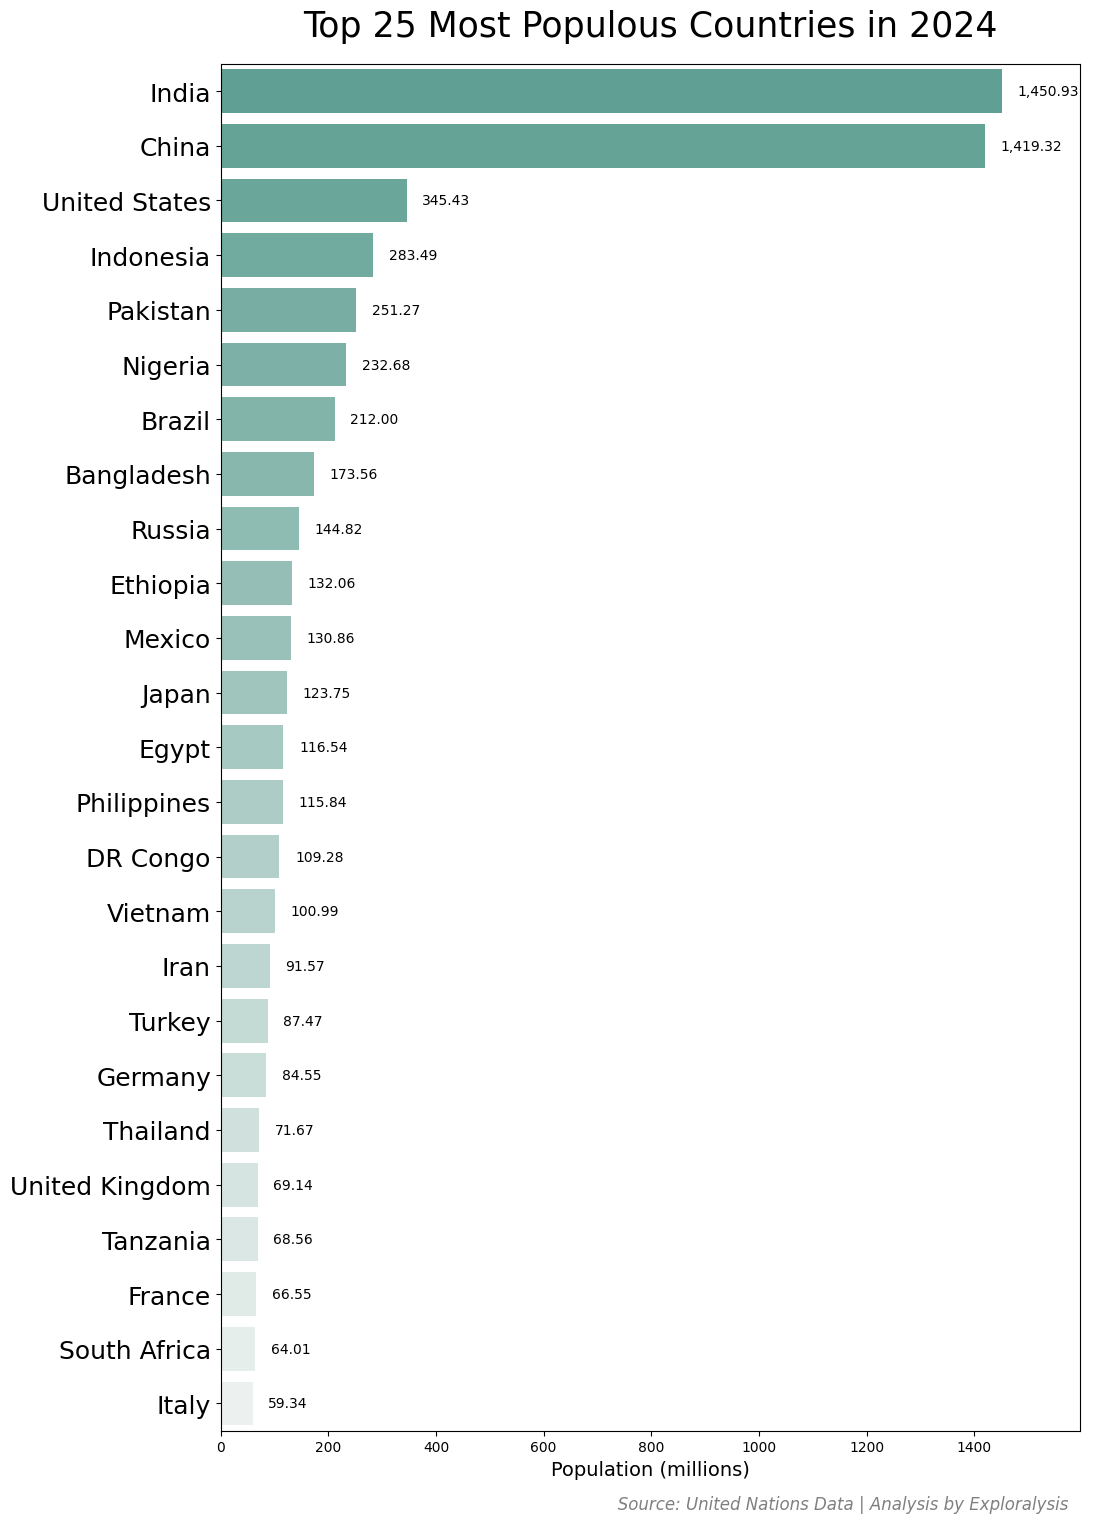
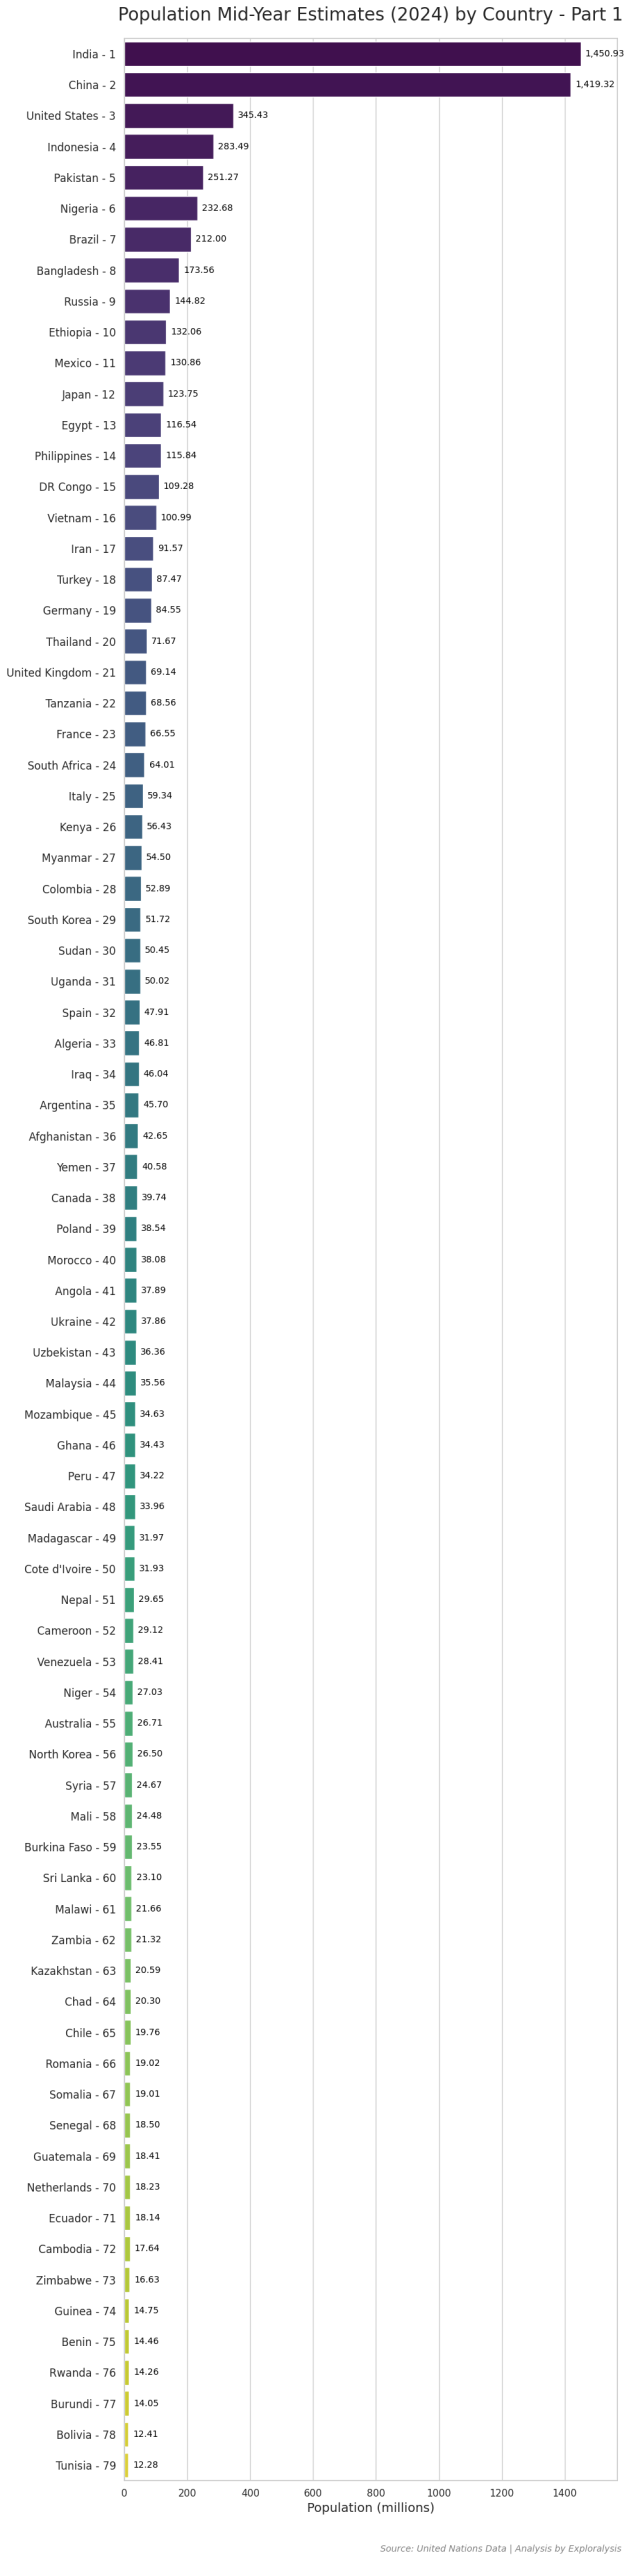
As of 2024, India is the world’s most populous country, followed closely by China. Both countries have populations of approximately 1.4 billion people, making them significantly larger than any other nation.
The United States ranks third, with an estimated 345 million people—only about one-fifth the size of India or China.
After the U.S., the population numbers decrease more gradually. The countries that complete the top 10 most populous nations are:
- Indonesia
- Pakistan
- Nigeria
- Brazil
- Bangladesh
- Russia
- Ethiopia
These rankings highlight the global population distribution and show which nations have the largest populations in 2024.
Population Growth Trends: Key Findings (2022-2024)
Island Nations Show Extreme Population Swings
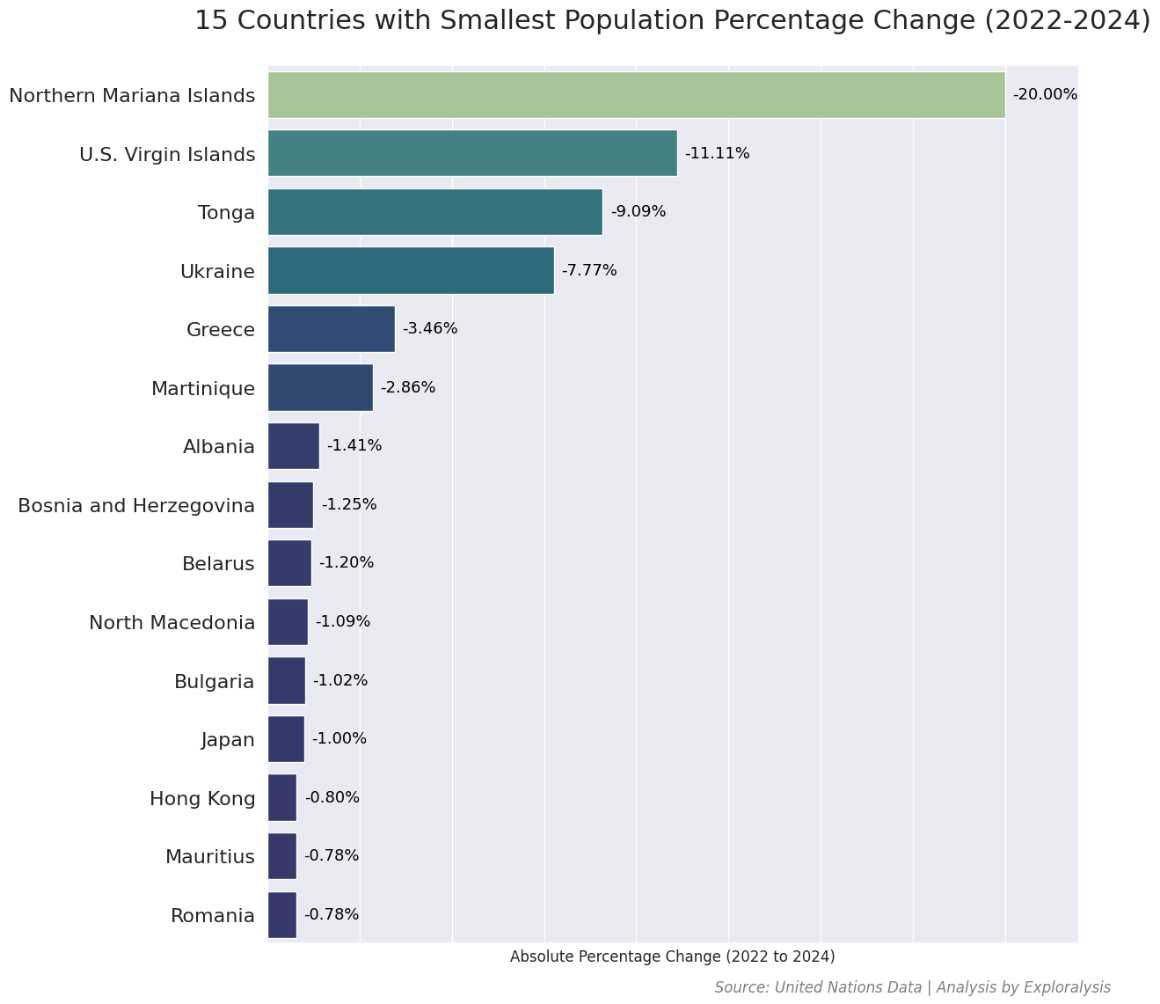
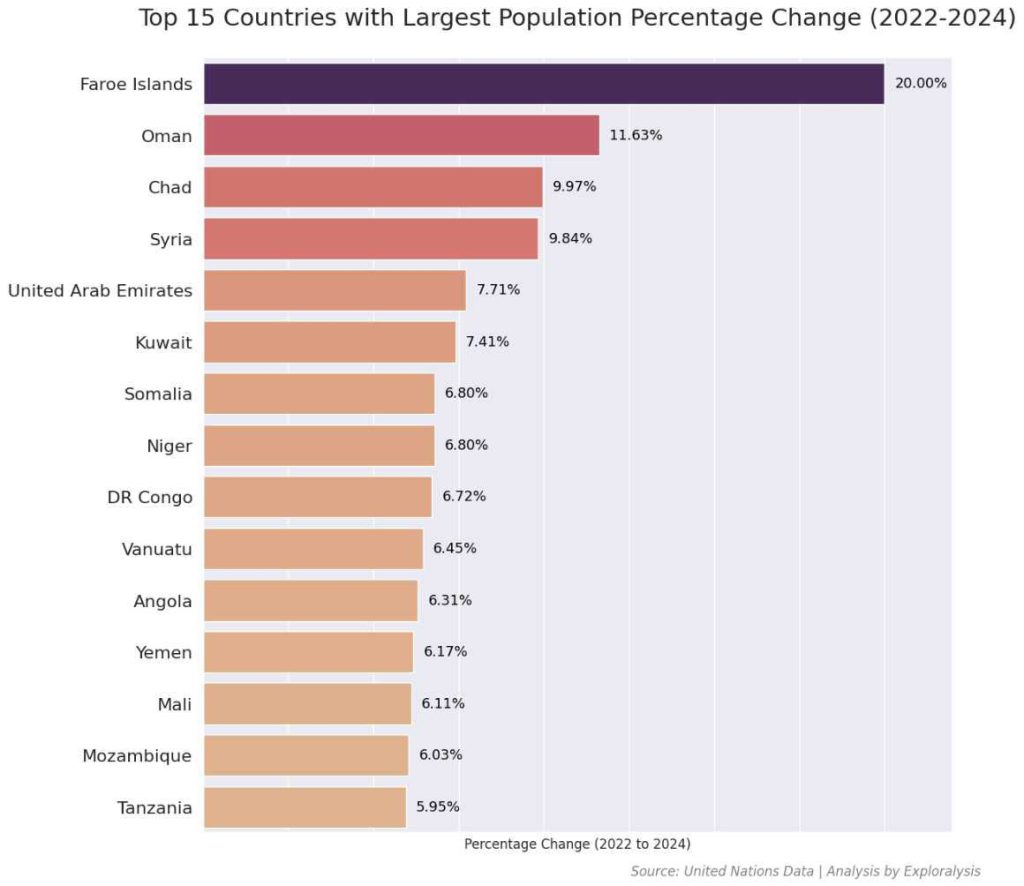
The Faroe Islands had the world’s highest population growth (20% increase) from 2022 to 2024. In contrast, the Northern Mariana Islands saw a 20% population decline during the same period. Island nations tend to experience more dramatic population changes due to their smaller populations and unique migration patterns.
Population Trends Among the Top 25 Most Populous Countries
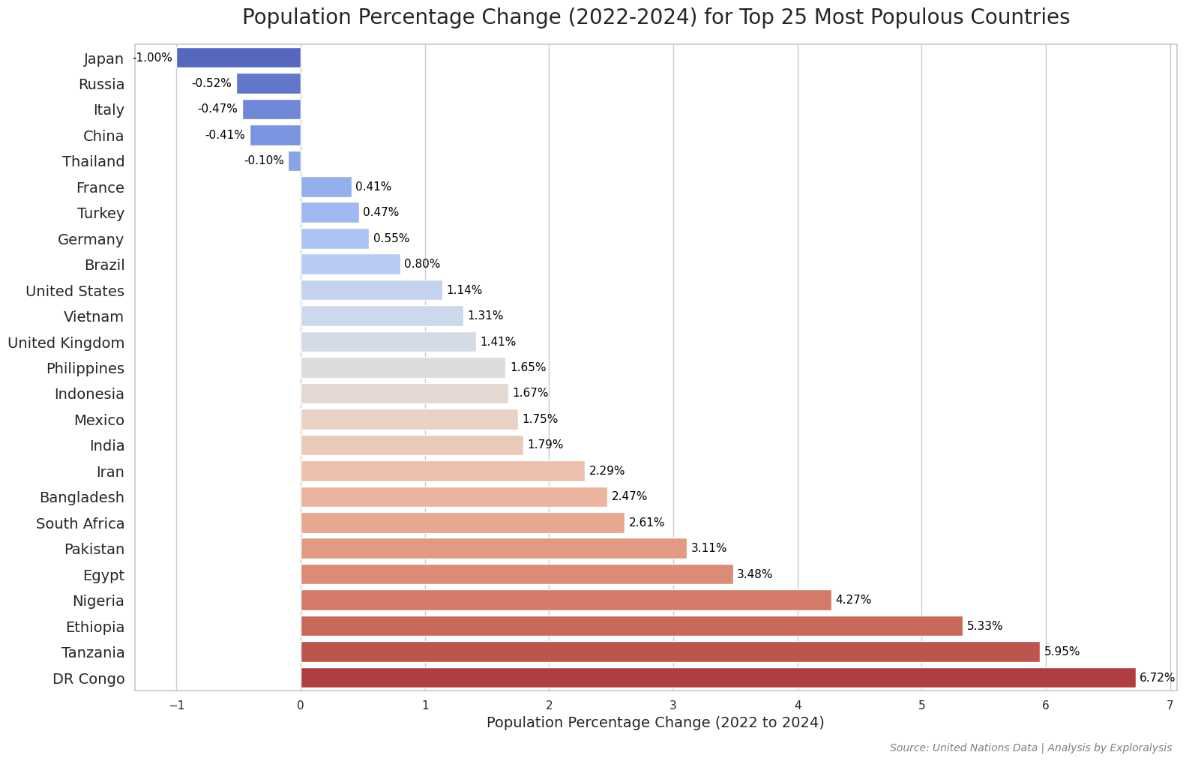
Among the world’s 25 most populous countries:
– Japan had the largest population decline (-1.00%)
– Only five countries saw negative growth:
– Japan (-1.00%)
– Russia (-0.52%)
– Italy (-0.47%)
– China (-0.42%)
– Thailand (-0.10%)
– The fastest-growing countries in this group were:
– DR Congo (+6.72%)
– Tanzania (+5.95%)
– Ethiopia (+5.33%)
– Nigeria (+4.27%)
– Egypt (+3.48%)
Global Population Change Distribution
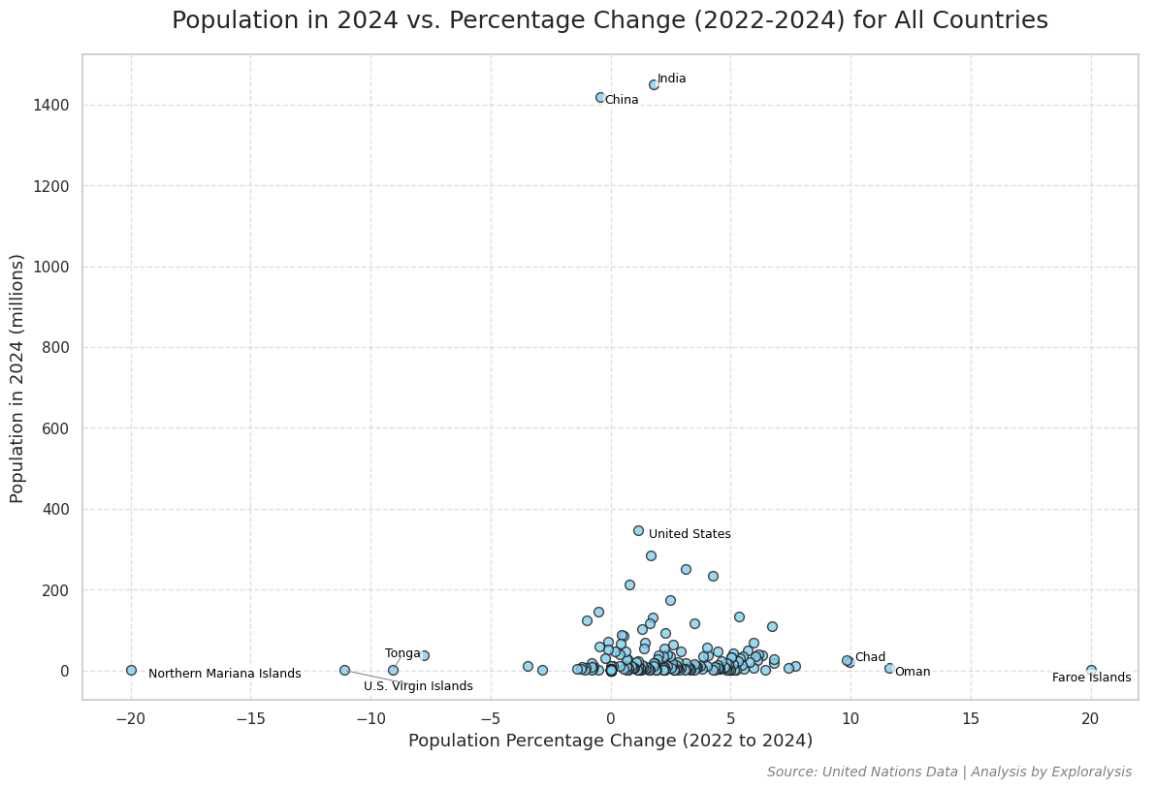
A scatterplot analysis reveals:
– Most countries experience population changes between -2% and +7%
– The majority have populations under 370 million
– Extreme growth or decline is rare among larger nations
Key Takeaways:
– Small island nations see the most volatile population shifts
– Africa leads in population growth among major countries
– Most large nations maintain stable, modest growth rates
This data highlights how geography and economic factors influence global demographic trends.
Top 10 Countries With the Highest Sex Ratio in the World
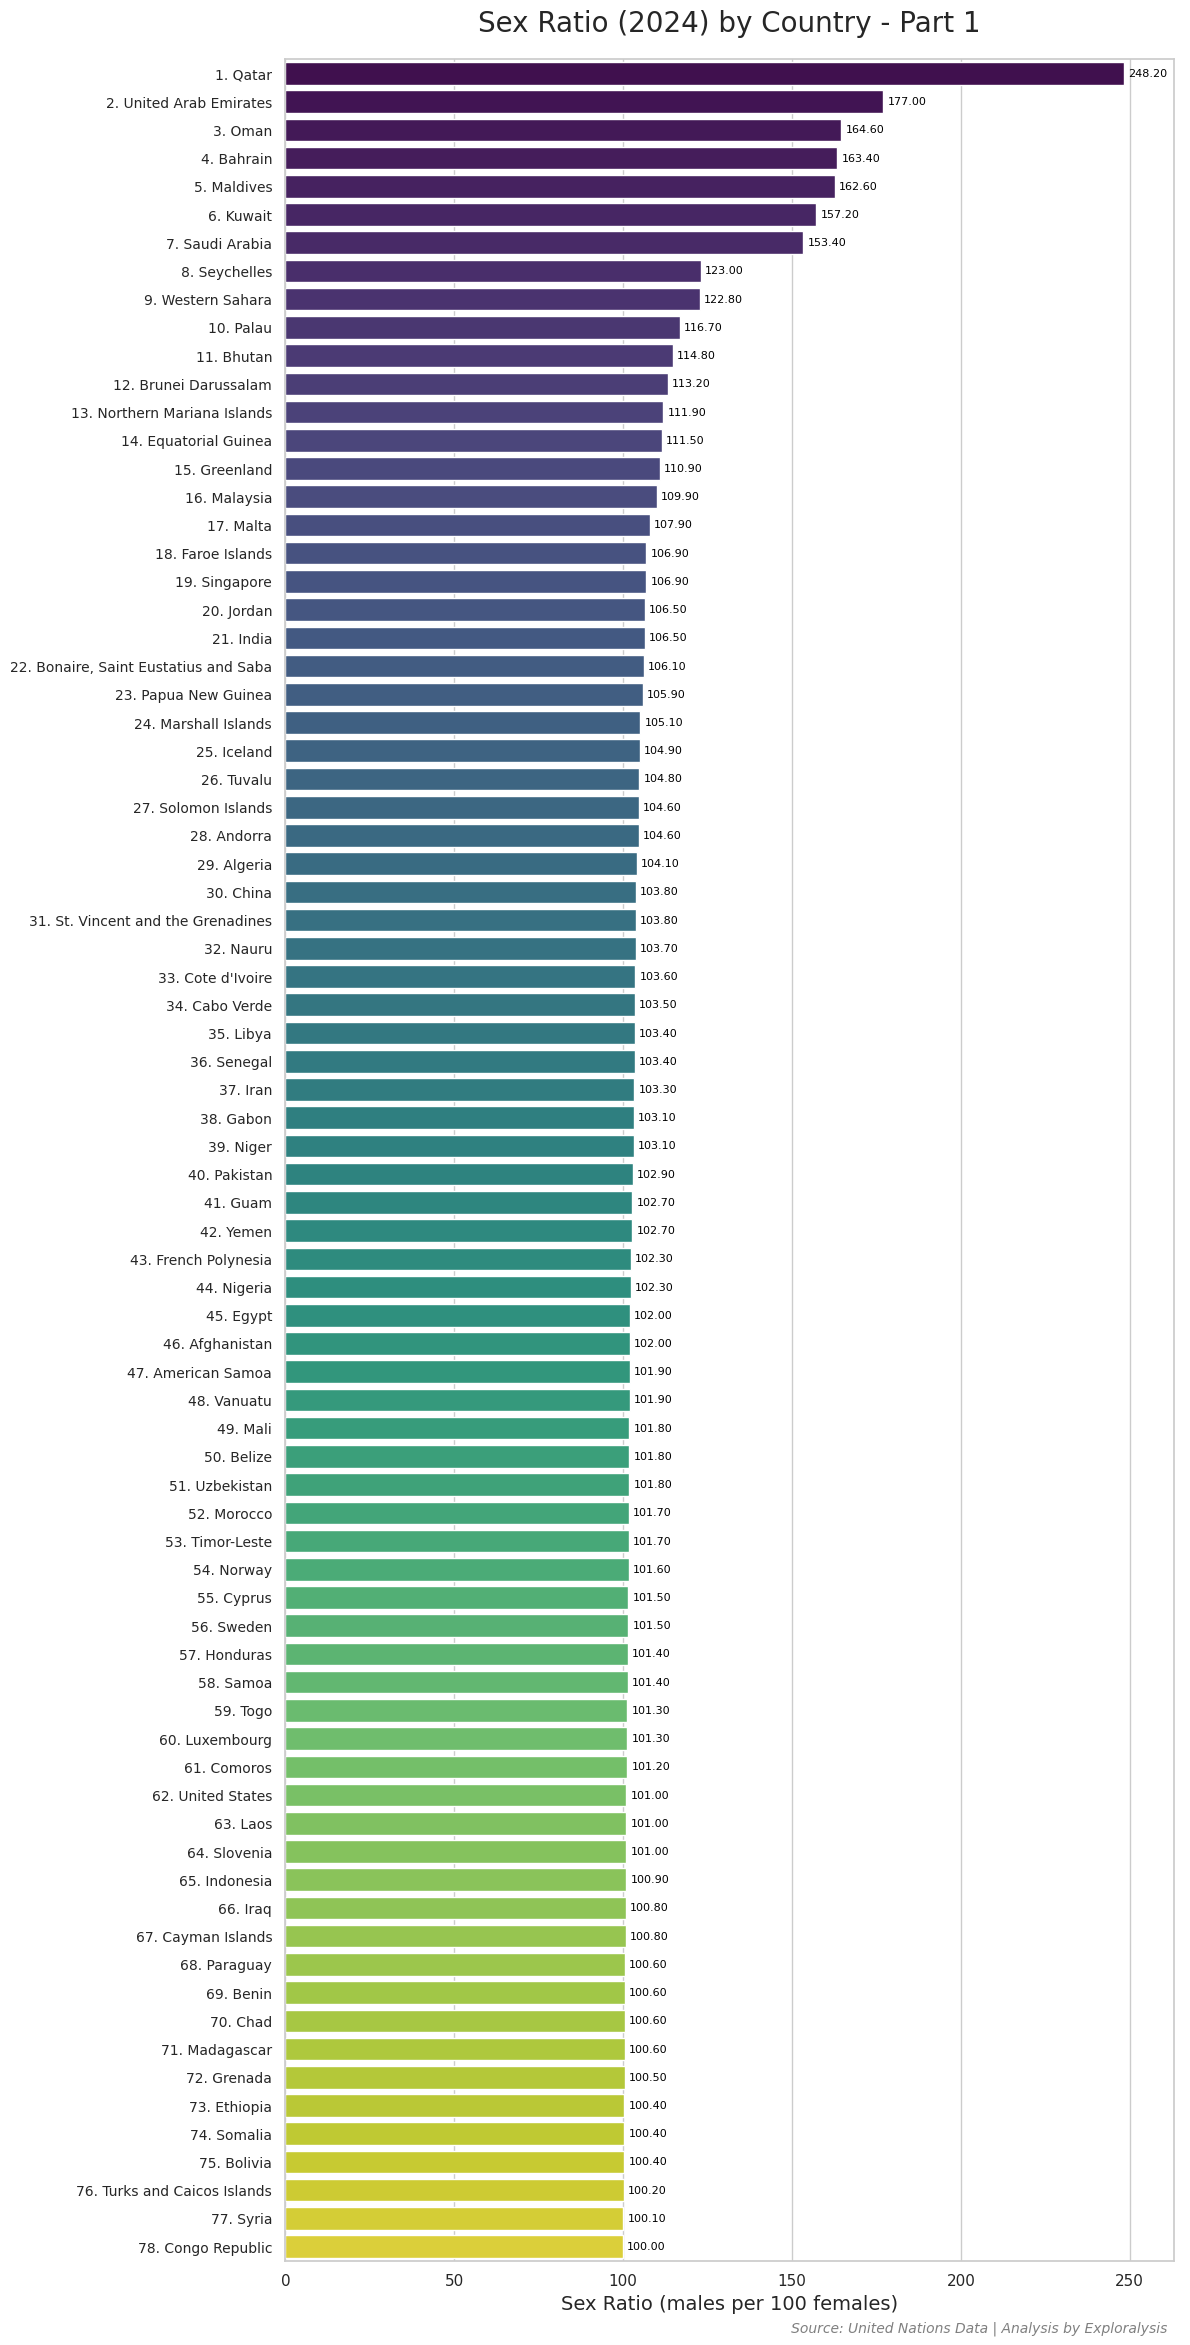
Sex ratio is an important demographic indicator that compares the number of males to females in a population. In this ranking, the sex ratio index is measured as the number of males per 100 females.
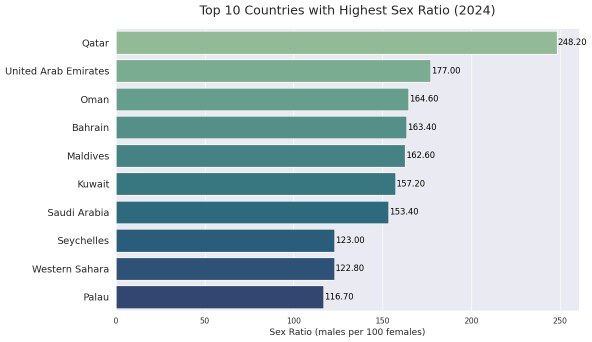
Among the top 10 countries with the highest sex ratio, 8 are located in Africa. The remaining two countries are Palau in Oceania and the Maldives in Asia.
Here are the top 10 countries with the highest sex ratio:
1. Qatar – 248.20
2. United Arab Emirates – 177.00
3. Oman – 164.60
4. Bahrain – 163.40
5. Maldives – 162.60
6. Kuwait – 157.20
7. Saudi Arabia – 153.40
8. Seychelles – 123.00
9. Western Sahara – 122.80
10. Palau – 116.70
Qatar tops the list with a striking sex ratio of 248.20, meaning there are two or more males for every female in the population. The top seven countries all have over 150 males per 100 females.
This list highlights regions with significantly higher male populations, often due to labor migration and other socio-economic factors.
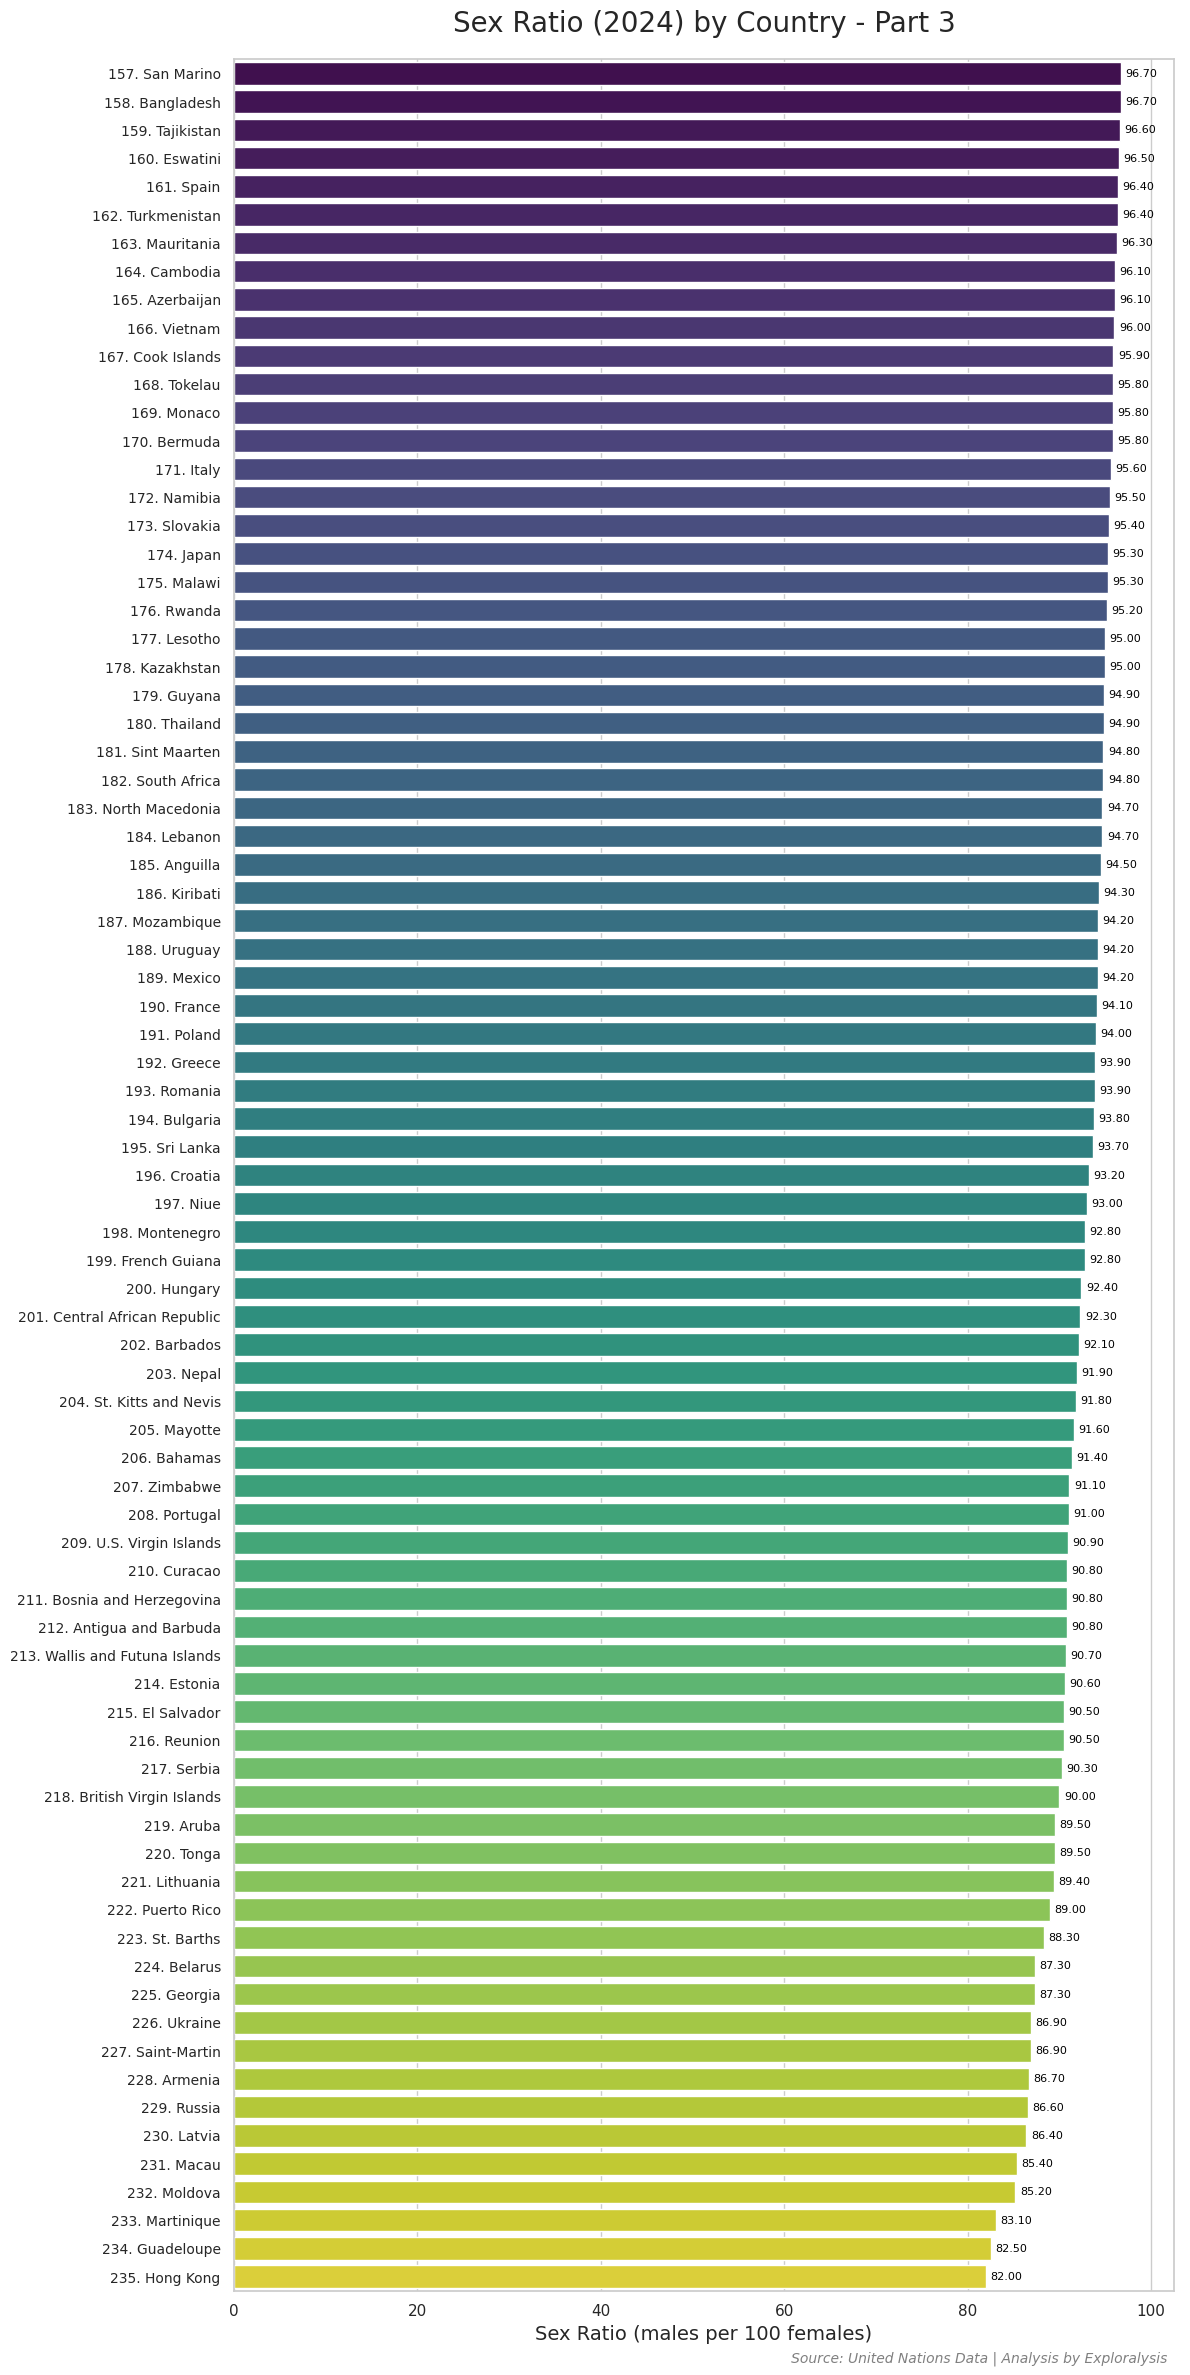
Countries With the Lowest Sex Ratios in the World
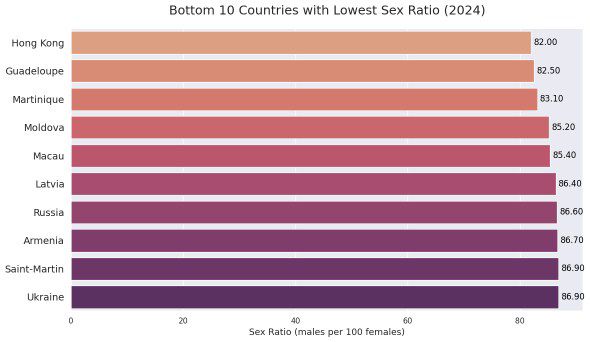
While the top 10 countries with the highest sex ratios show extreme male-dominated populations, the bottom 10 countries present a much more balanced distribution. Each country in this list has approximately 80 to 87 males for every 100 females.
In contrast to the top 10, where sex ratios range from 110 to over 250 males per 100 females, the countries with the lowest sex ratios are significantly more even. Another major difference is the lack of geographic or cultural clustering. These countries are scattered across different regions and do not share a common identity or characteristic that defines the group. This randomness stands in contrast to the top 10 list, where most of the countries are located in Africa.
Here are the bottom 10 countries in terms of sex ratio:
1. Hong Kong – 82.00
2. Guadeloupe – 82.50
3. Martinique – 83.10
4. Moldova – 85.20
5. Macau – 85.50
6. Latvia – 86.40
7. Russia – 86.60
8. Armenia – 86.70
9. Saint-Martin – 86.90
10. Ukraine – 86.90
These nations represent the lowest male-to-female ratios globally, offering a striking contrast to the top 10 countries with significantly higher male populations.
Is There a Link Between Male Population Proportion and Population Growth?
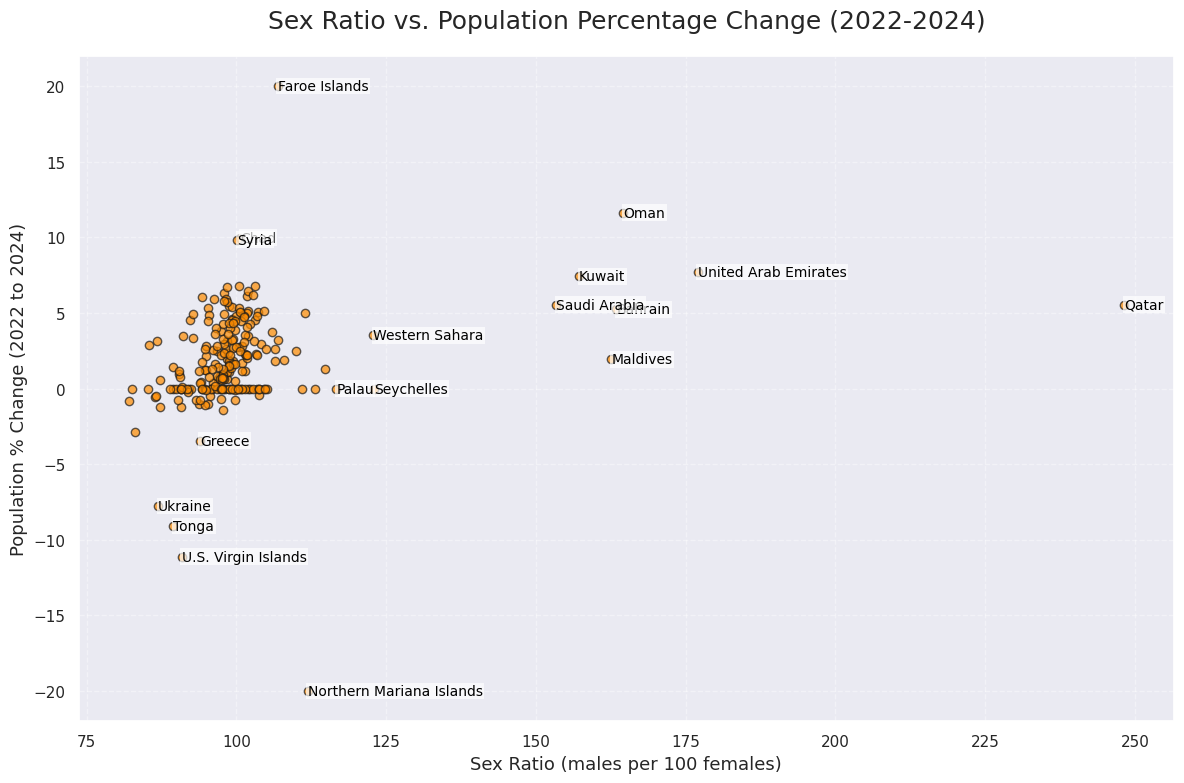
An observable trend suggests a linear positive correlation between the proportion of males in a population and the percentage increase in that population. In simpler terms, it appears that countries with a higher proportion of males tend to experience greater population growth.
One rough interpretation of this pattern is that increasing the male proportion in a population could potentially contribute to higher population growth rates. However, this idea, often referred to as demographic engineering, raises serious ethical concerns.
Any attempt to manipulate sex ratios for population gain requires thorough and critical examination. Such strategies are not only controversial but can also place unfair social and reproductive pressure on females, leading to long-term societal imbalances and gender-based issues.
Understanding the relationship between demographic structure and population growth is important, but it must be approached responsibly, with ethical considerations at the forefront.
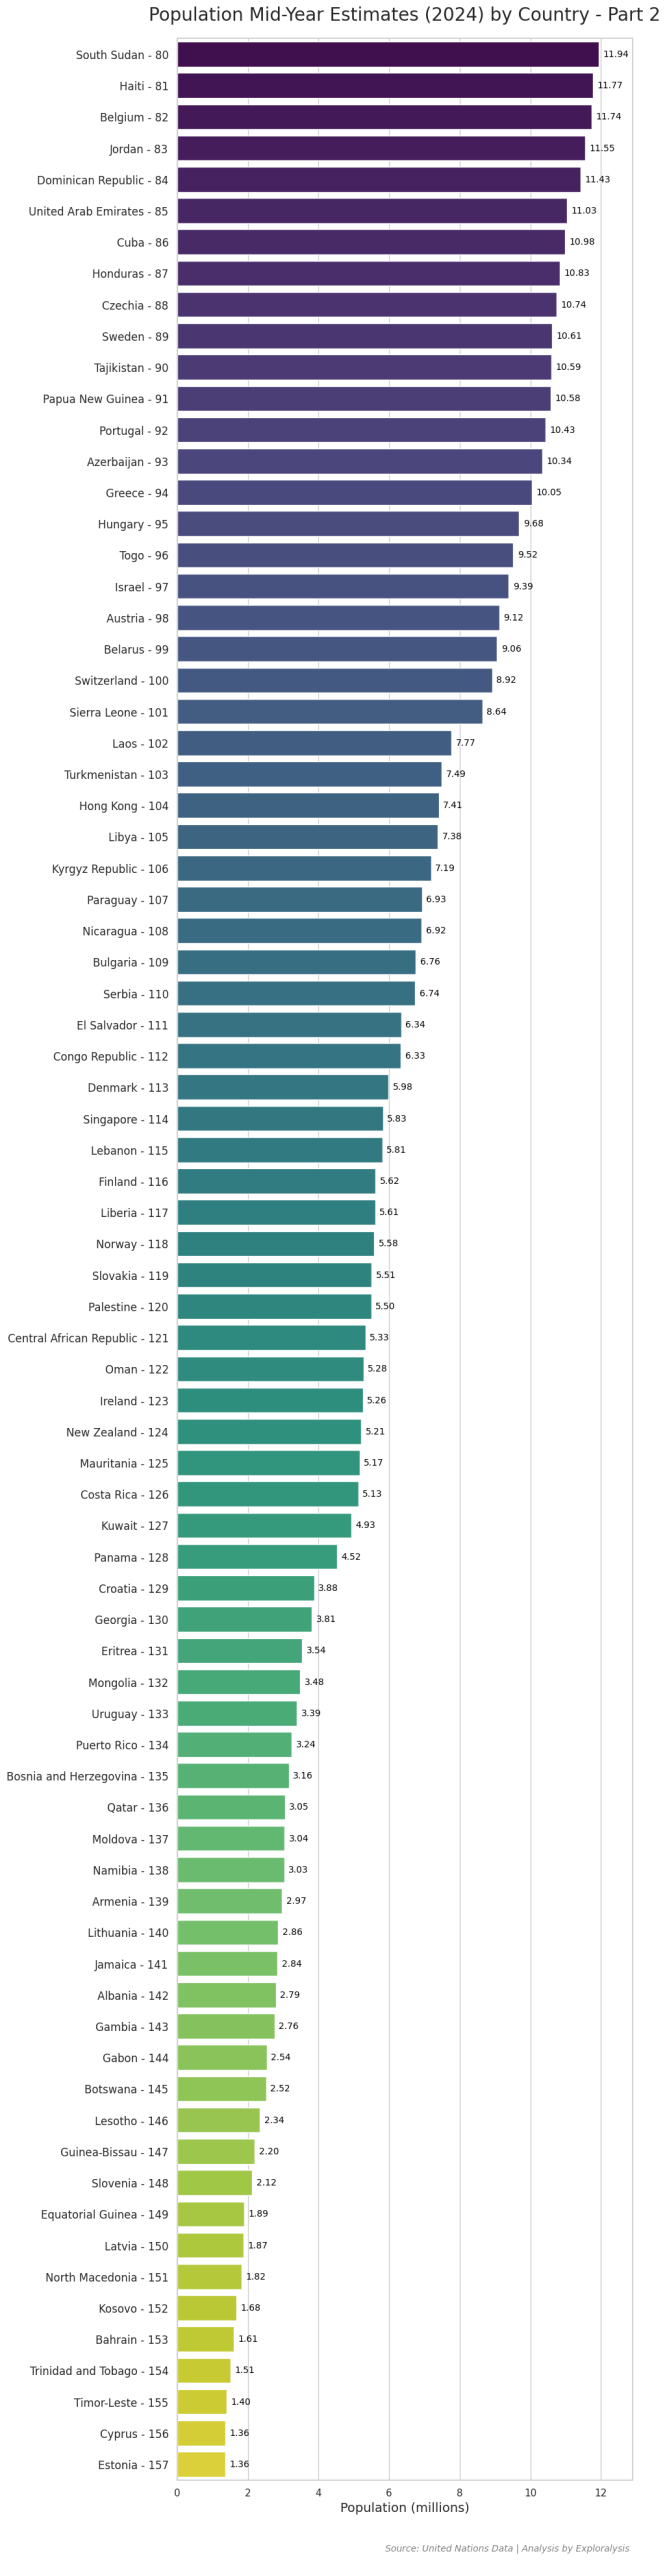
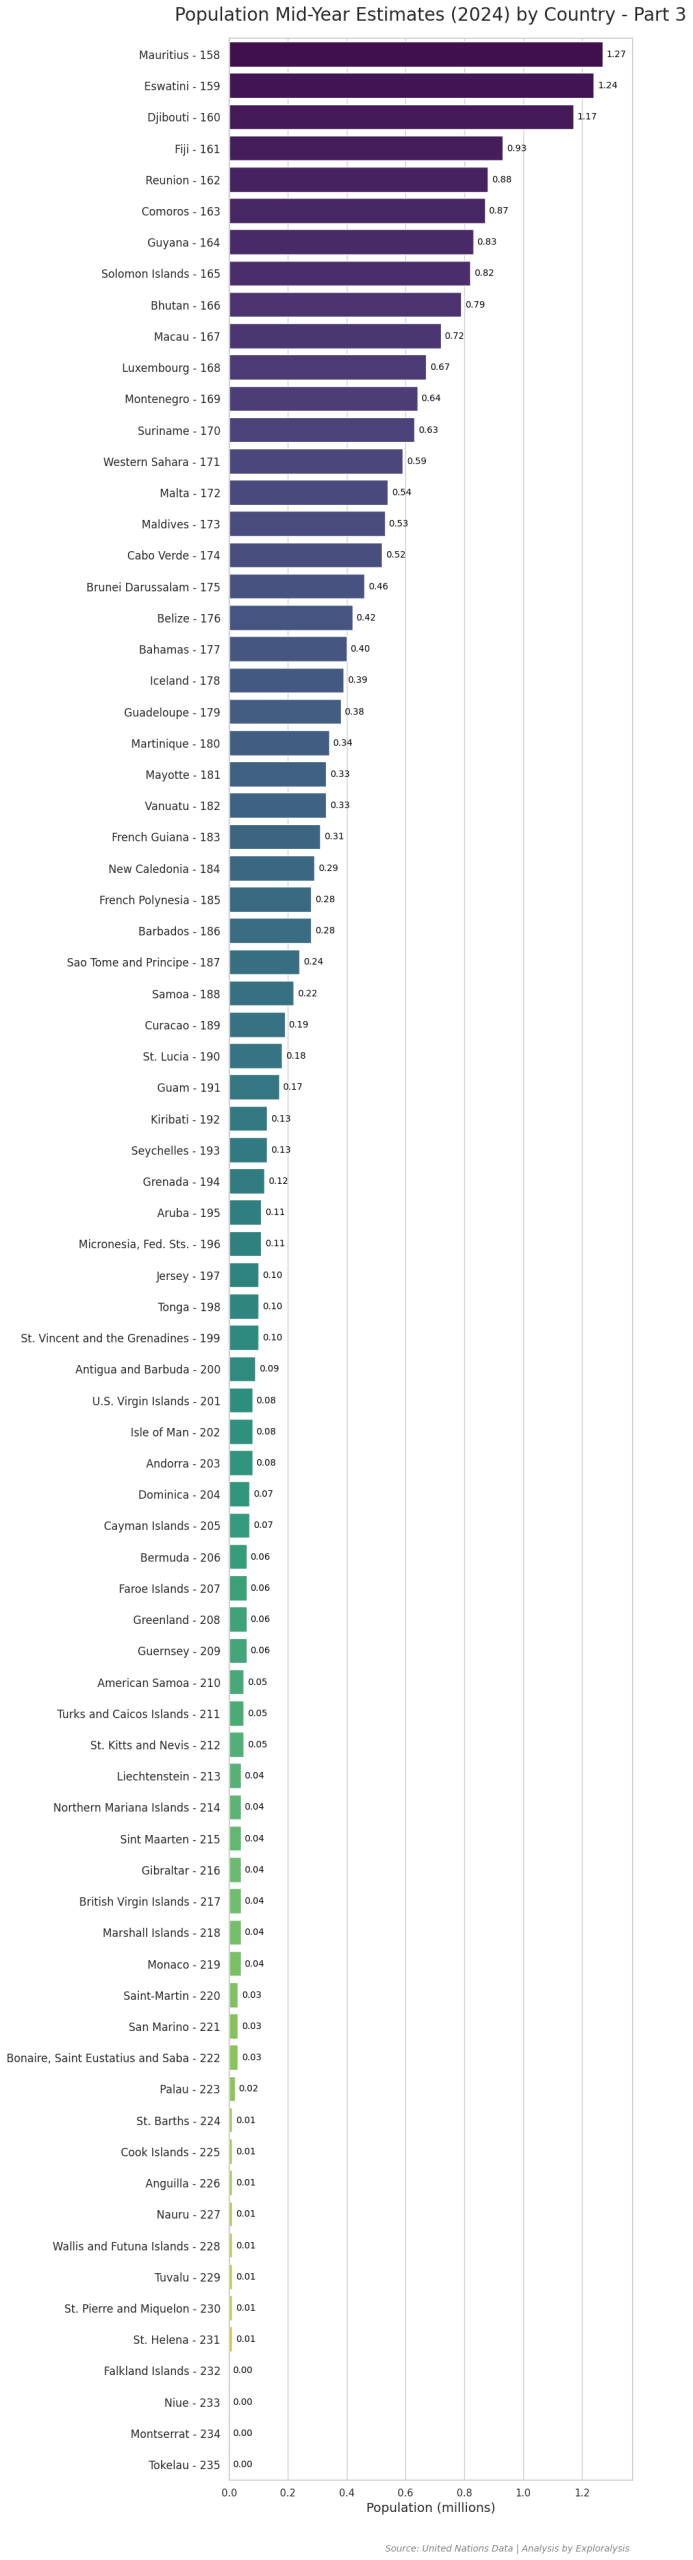
Here is the complete list of countries along with their most recent population data (2024).
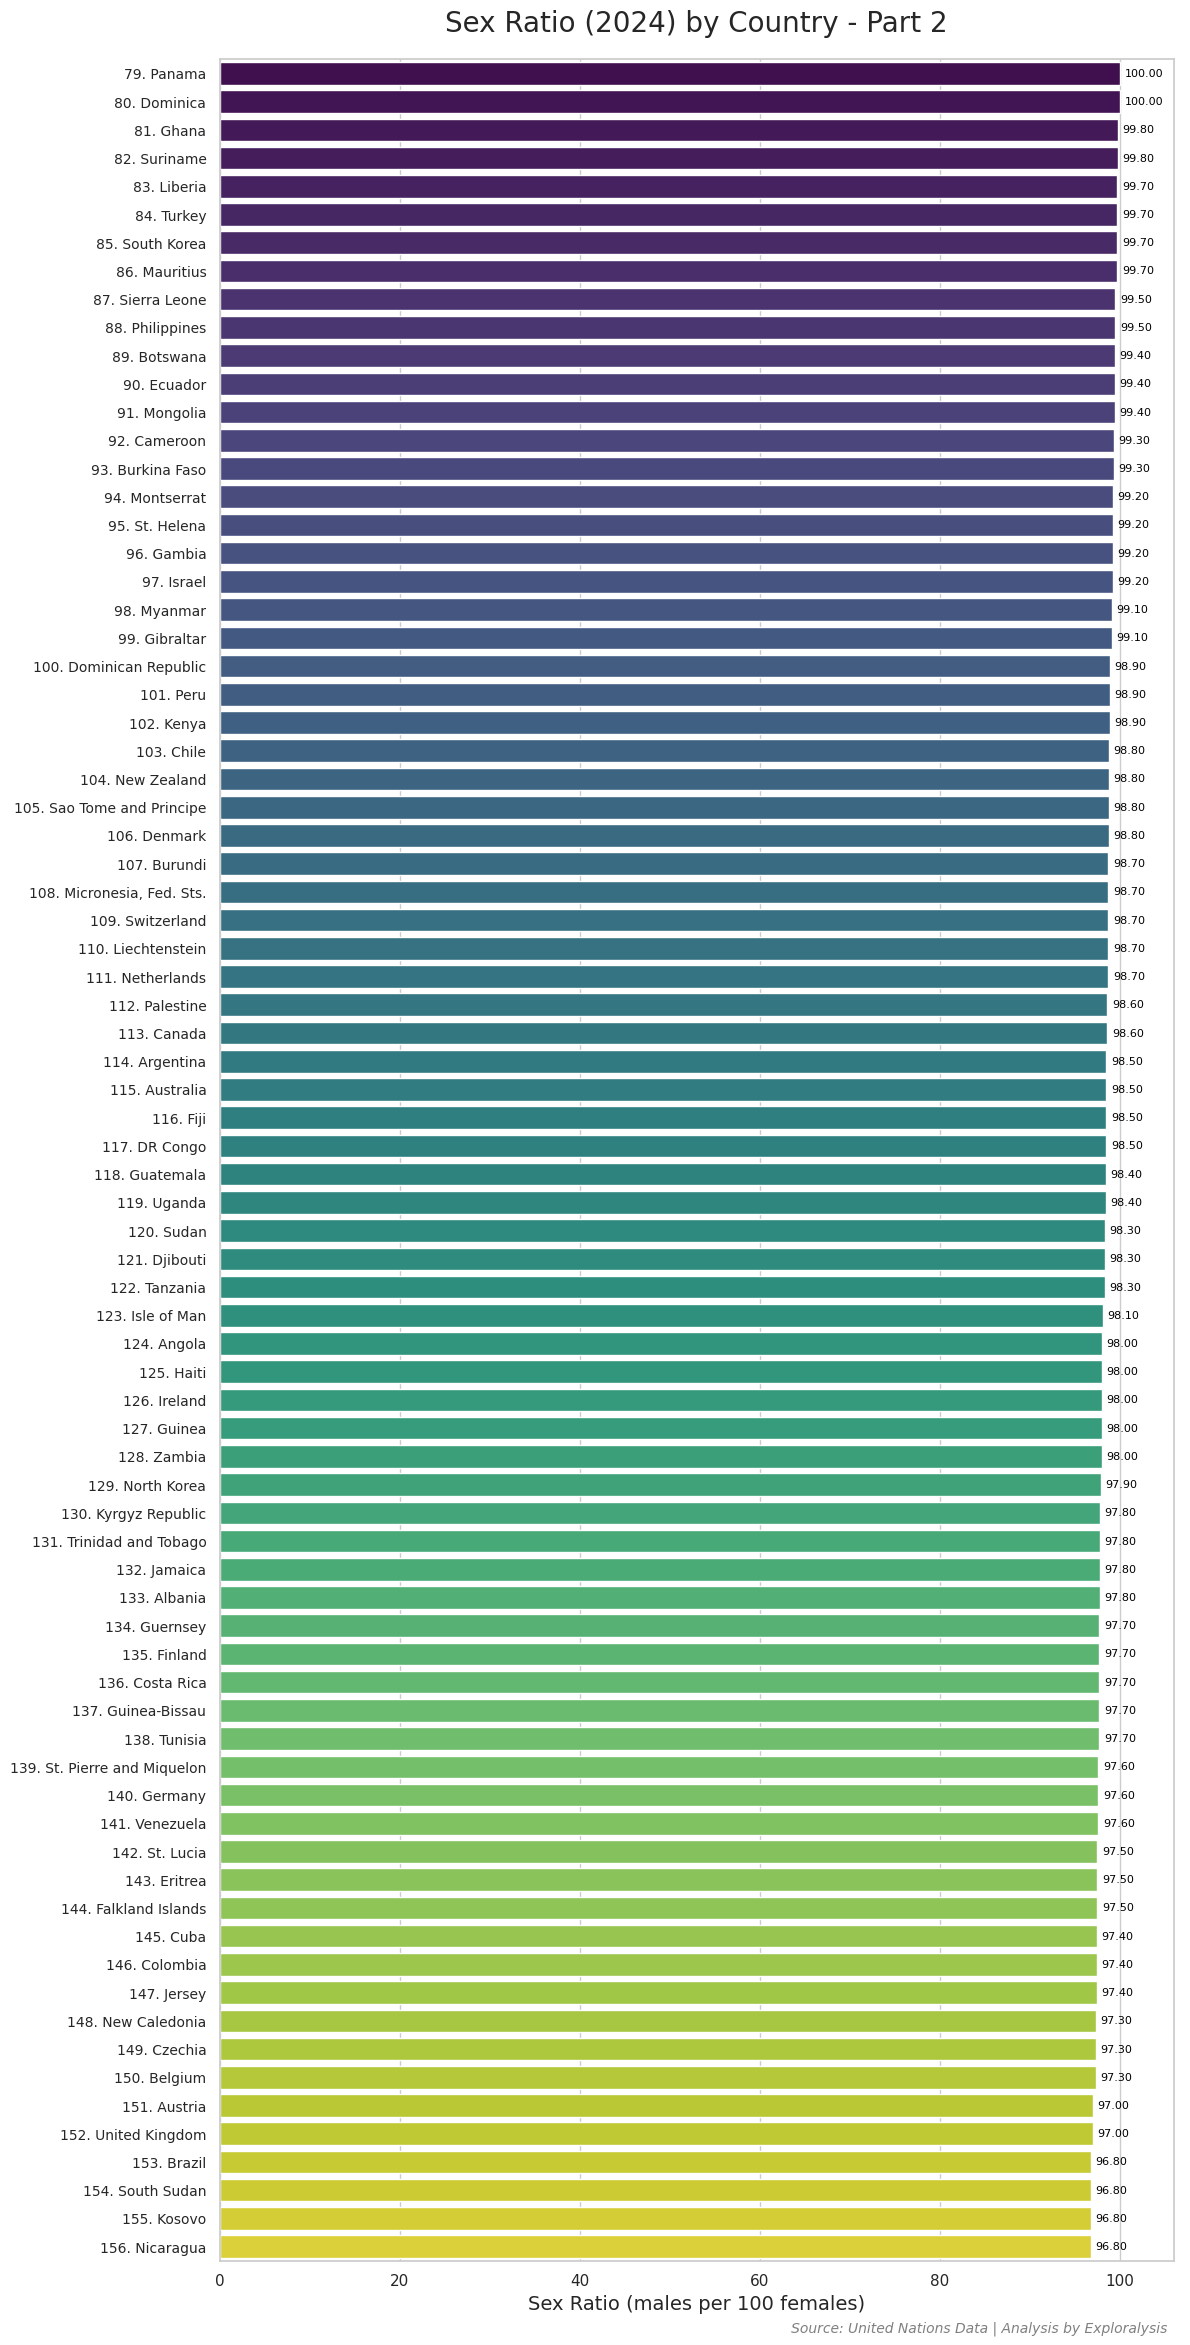
Here is the complete list of countries with their most recent data on the number of males per 100 females (2024).
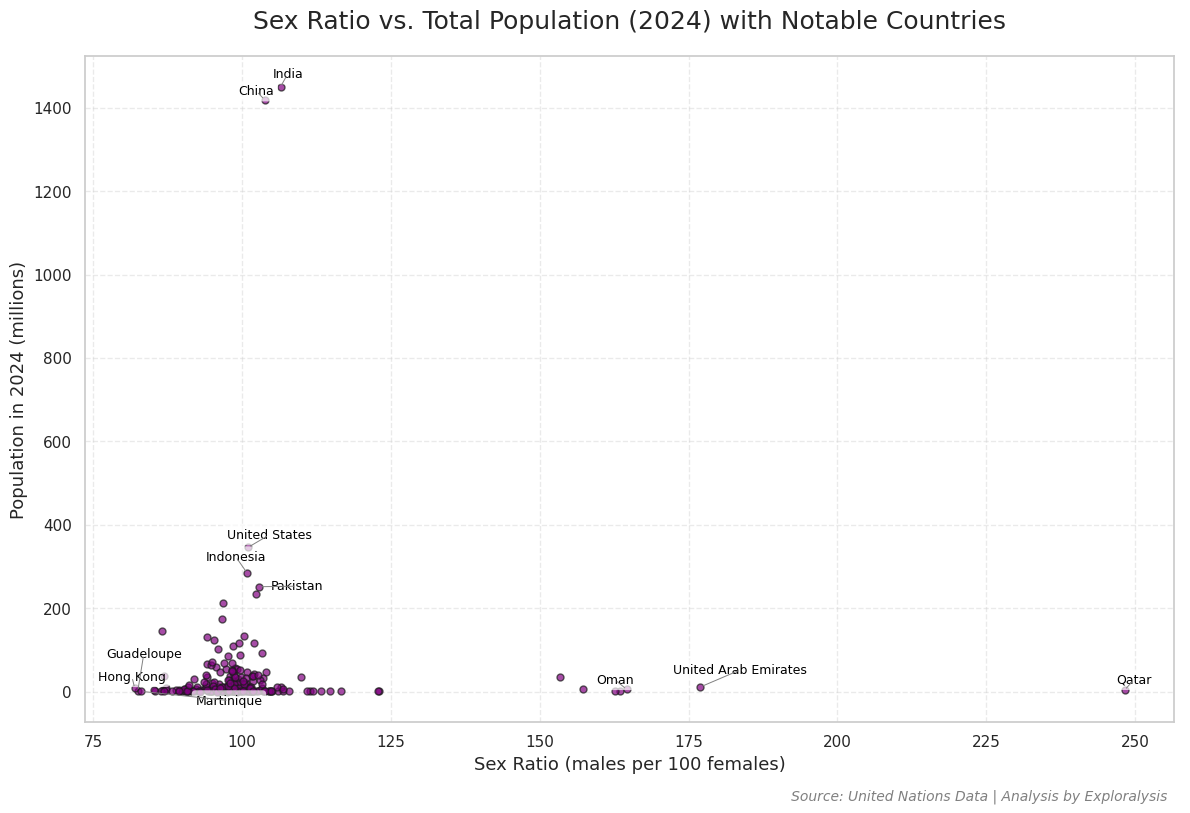
In the scatter plot comparing sex ratio to total country population, the correlation between the number of males per 100 females and overall population size appears to be very weak. This relationship is significantly less pronounced than the clearer trend seen in the sex ratio versus percentage population change scatter plot.
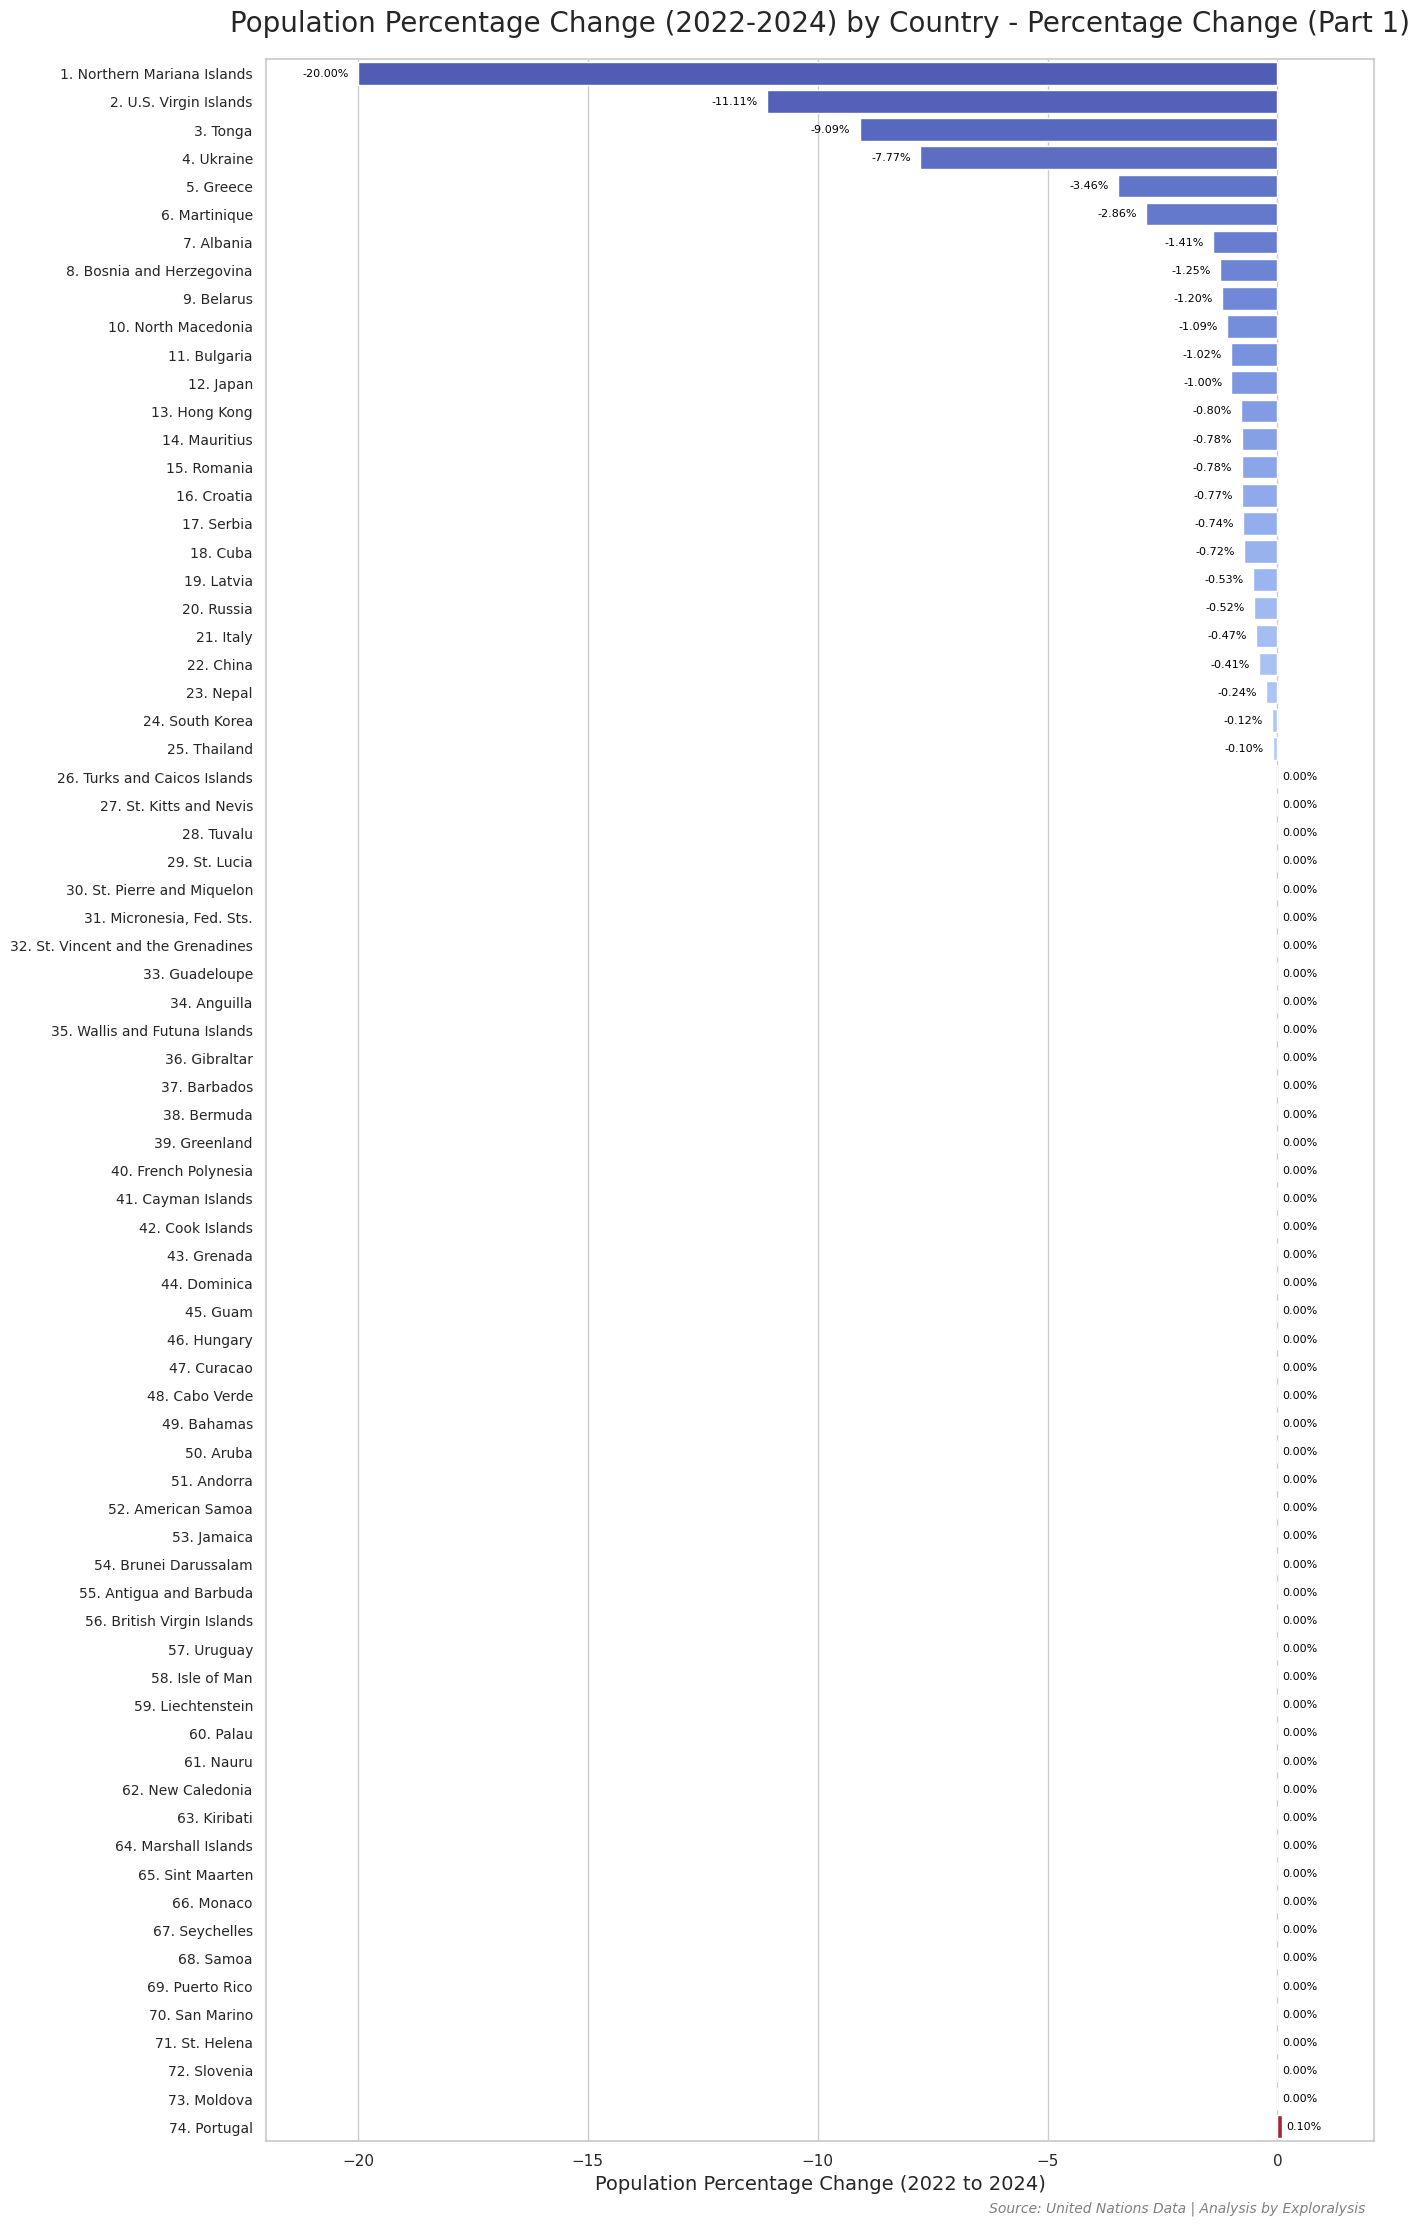
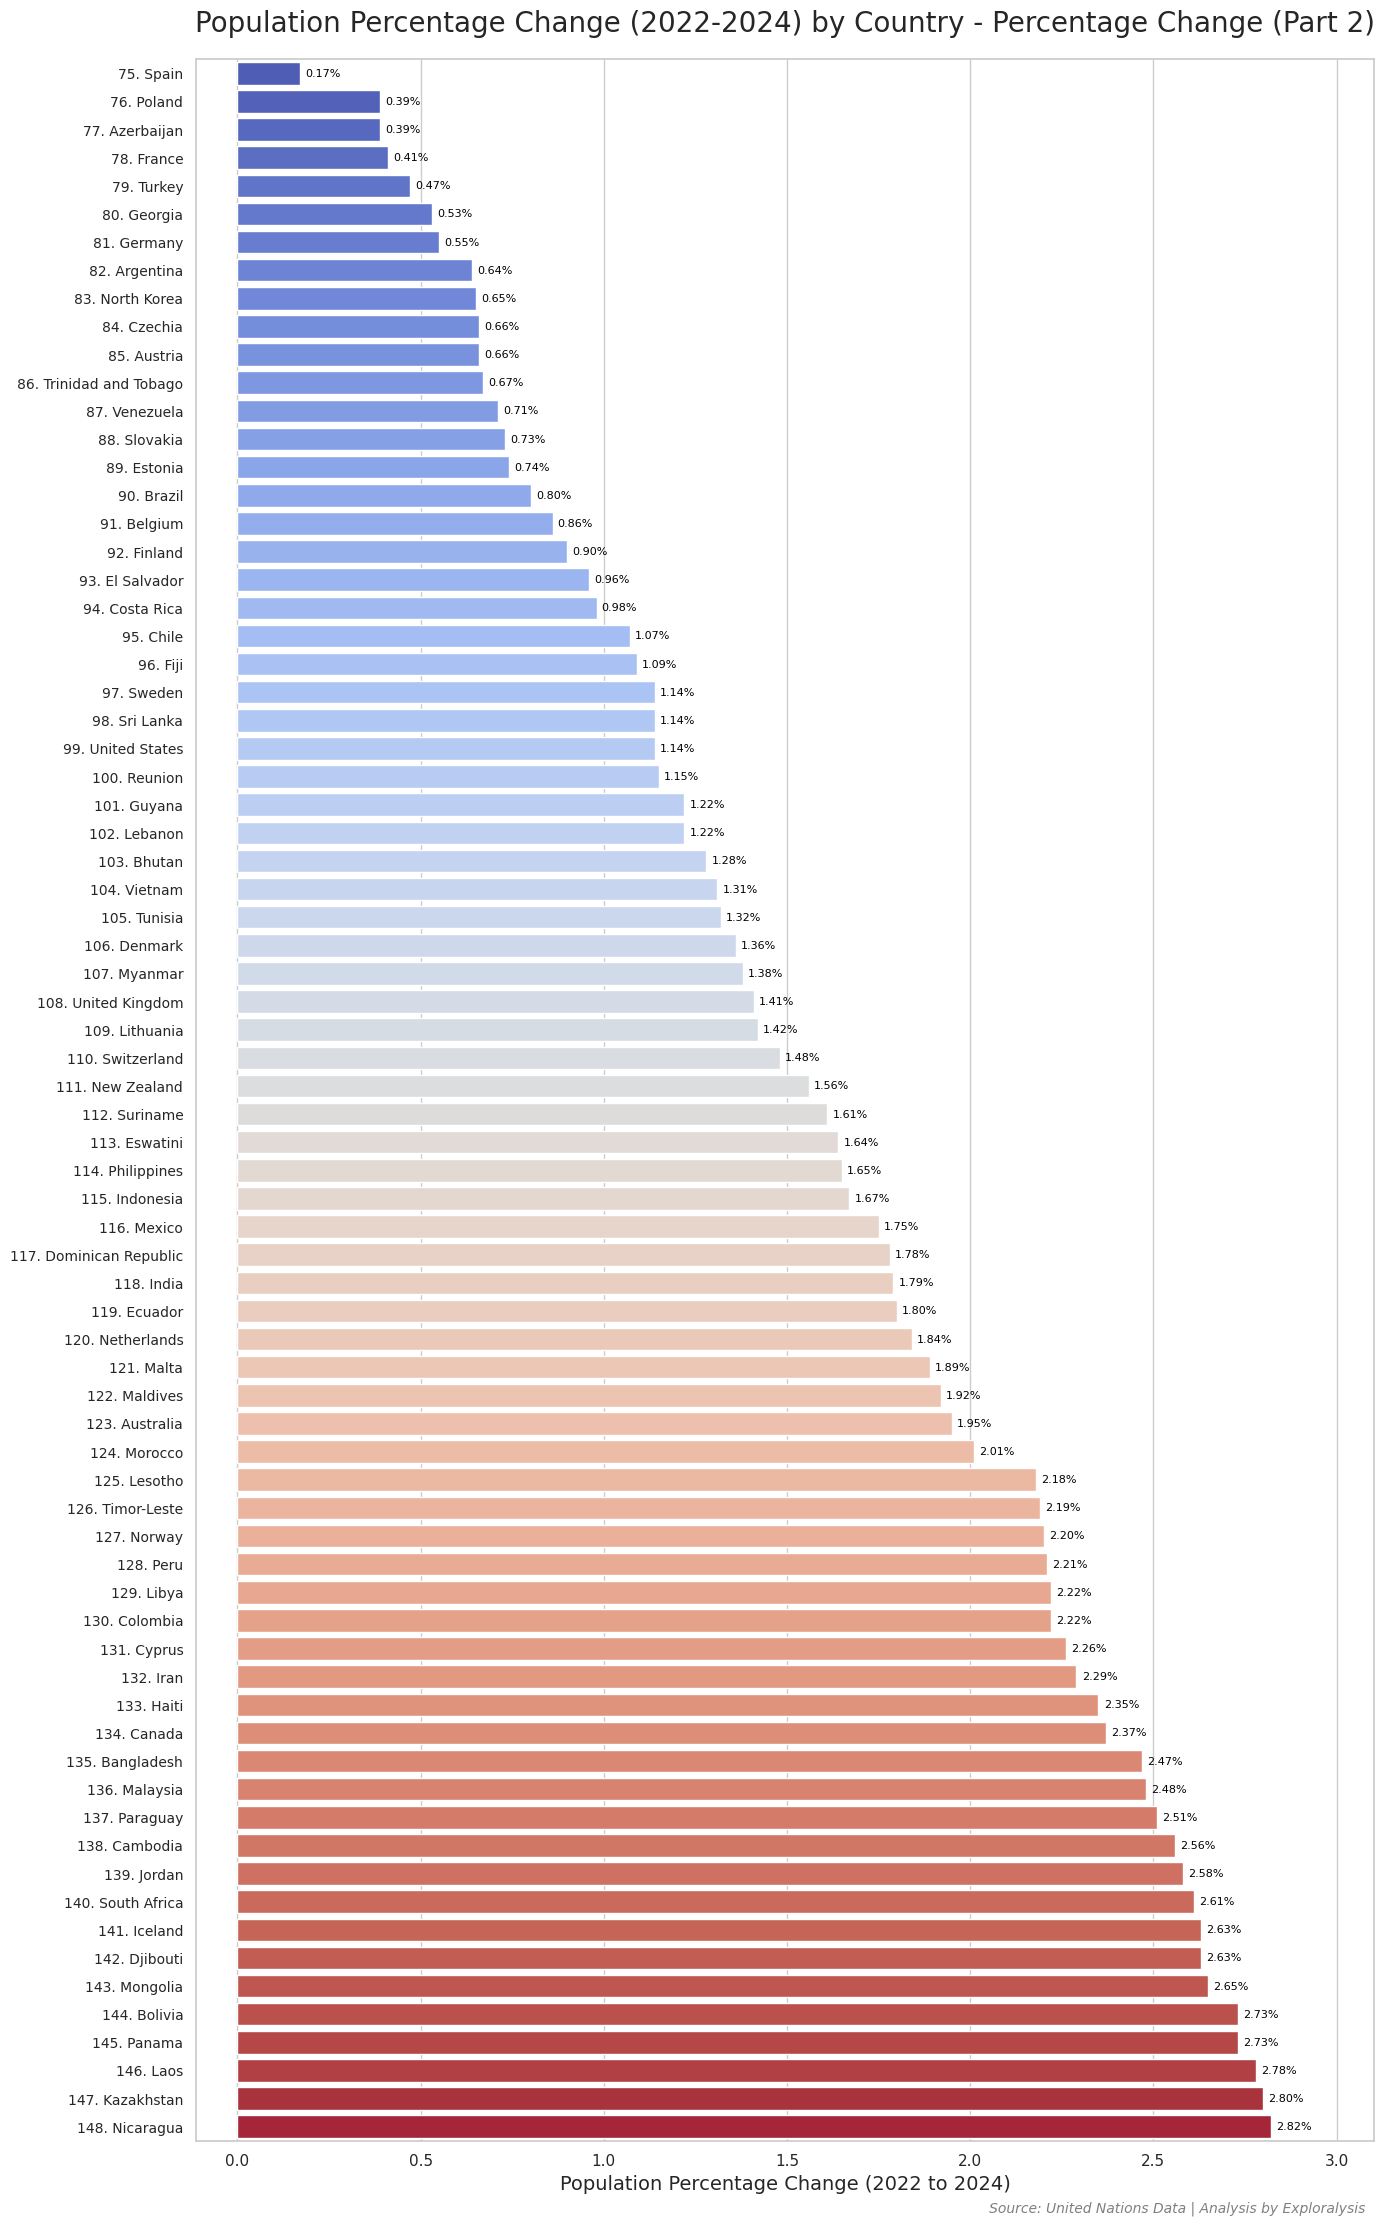
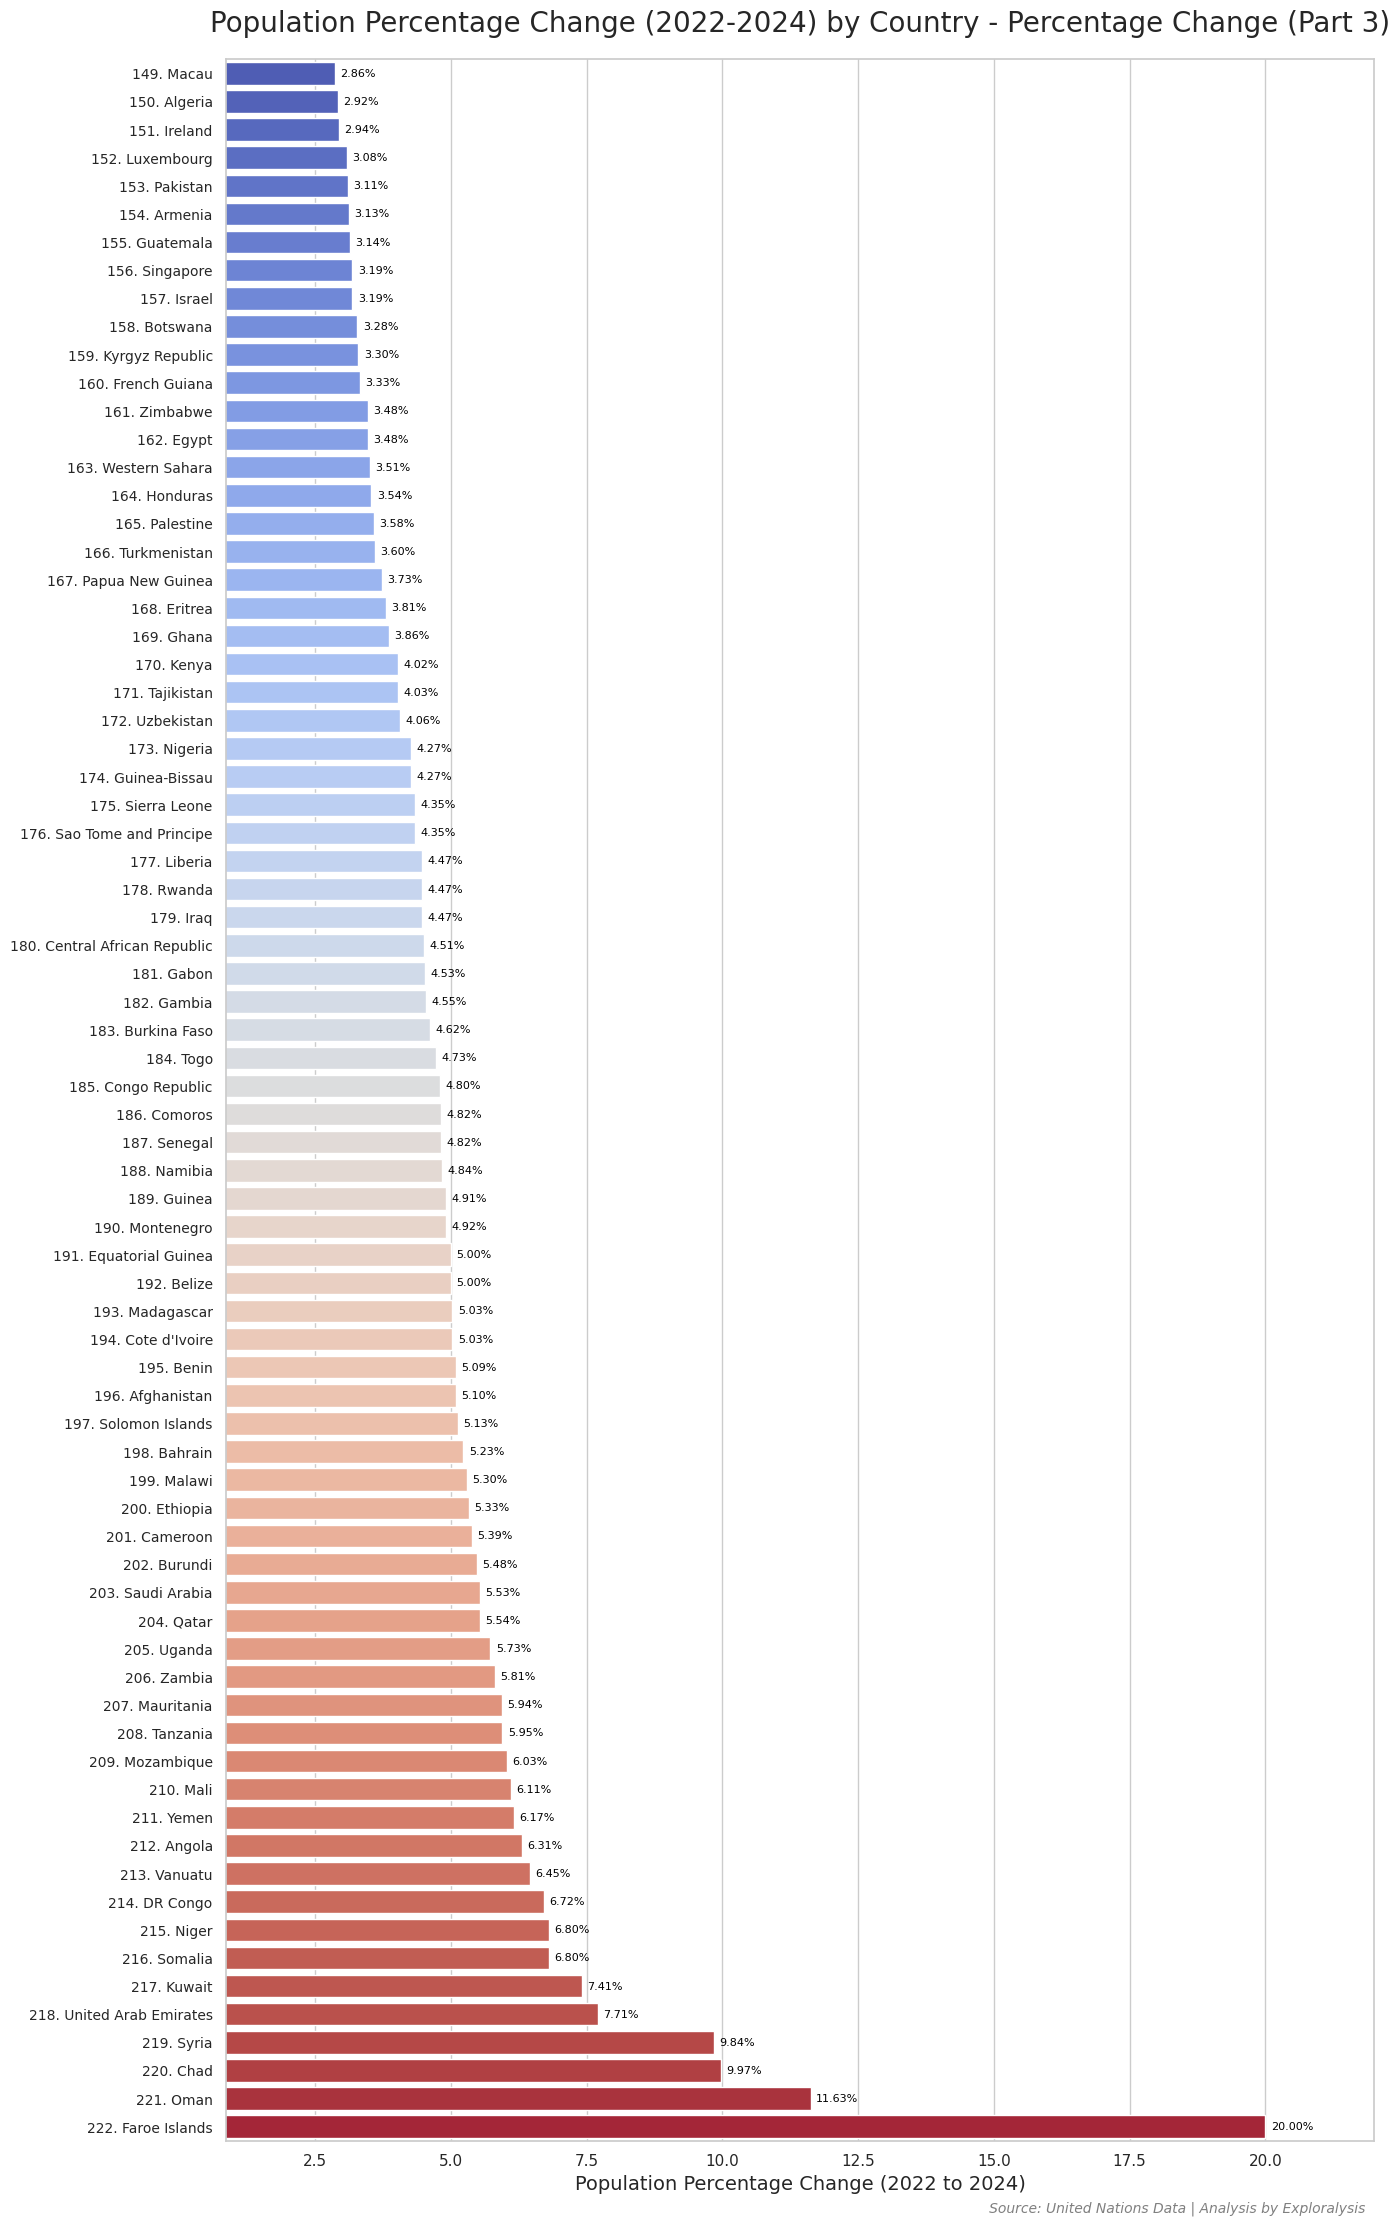
Here are the bar plots showing the percentage change in population for all countries from 2022 to 2024.
Population Analysis: Total Population, Growth Rate, and Sex Ratio
This section presents an analysis of three key demographic indicators: total population, population percentage change, and sex ratio (measured as the number of males per 100 females), visualized through bar charts.
Total Population Trends
Total population figures tend to be heavily influenced by long-term geographical and historical factors. This explains why certain countries stand out significantly across different continents. These factors—such as land size, historical empires, colonial legacies, and natural resources—create patterns that are more geographically distributed and less predictable compared to the other demographic metrics.
Population Percentage Change
Population growth rate, measured as percentage change, tends to be more sensitive to the size of a country’s population—especially in nations with small populations. This sensitivity is evident in the data: countries at both extremes of the growth spectrum are often small island nations. For instance, the Faroe Islands show the highest growth rate, while the Northern Mariana Islands show one of the steepest declines.
Interestingly, on the negative end of the spectrum (lowest percentage change), many of the countries are small island states. However, on the positive end (highest growth rates), many are not tiny islands but small- to medium-sized nations in Africa and the Middle East, including Oman, Chad, Syria, the UAE, and Kuwait. This pattern suggests that social and cultural factors—such as migration policies, fertility rates, and economic conditions—play a more significant role than population size alone.
Sex Ratio Patterns
Compared to population size and growth rate, sex ratio data shows much less variation globally. This is likely due to the predominant influence of biological factors. However, the top seven countries with the highest male-to-female ratios stand out significantly. In these countries—many of which are Muslim-majority nations—social, cultural, and possibly religious factors may contribute to the skewed sex ratios, such as labor migration trends or gender-specific population policies.
Cover photo by Ekansh Saxena on Unsplash
( Nugroho Budianggoro )